

Introduction Agile Metrics
Due to the ever-changing business dynamics in the past couple of decades, agile ways of working have sidelined other approaches in the software development space. Initially, this transition faced a lot of resistance due to the nature of vague explanations to specific and pointed questions by the stakeholders and the leadership’s emphasis and necessity on making data-driven decisions. This was a needless battle. In this blog we will discuss how we can leverage various agile metrics for leadership to ensure transparency and provide leadership with actionable data points on a consistent basis.
The vagueness around agile was triggered by two words very popularly used to define agile implementation ie. ‘Mindset’ & ‘Culture’. While this made all the right noise, it often gave the impression that agile does not place importance on ensuring execution certainty for driving the business as a whole or its microelement called project.
Traditional project management techniques were well established, proven, and trusted as they assured the data on transparency, predictability, time to market, productivity, customer satisfaction, and other important business parameters. Leaders need to have the right visibility at all times to understand the health of execution to drive things forward confidently with clarity and get deeper insights to pivot when necessary.
In this blog, we will discuss agile metrics and how to leverage them to help the leadership. We will try to answer the following questions based on our experience designing and driving agile transformation journeys for our clients as an agile consulting company.
- What are agile metrics and measurements?
- What are some agile metrics for leadership?
- What are the agile adoption metrics for leadership?
- What are the agile business value metrics for leadership?
- What are some of the agile metrics examples?
- What are the metrics for agile transformation?
- Who are the various leaders in the context of agile transformation?
- What are the most relevant metrics for leaders in agile transformation?
- What is the difference between the nature of agile transformation in a service company vs agile transformation in a product company?
- What are agile efficiency metrics for leadership?
- What are agile flow metrics for leadership?
- What is meant by a Burndown Chart, Velocity Graph, Control Chart, Cumulative Flow Diagram, Defect Removal Efficiency, Commitment Variance, Velocity Variance, and Agility Health Assessment from an agile metrics and measurement perspective?
- What is Flow Distribution, Flow Velocity, Flow Time, Flow Load, Flow Efficiency, and Flow Predictability in agile flow metrics for leadership?
- What are Value Stream Specific KPIs, OKRs or Objectives & Key Results, Average wait time, Time ‘in the zone’, Holding cost vs Transaction cost, and DORA Metrics in agile leadership metrics?
What are Agile metrics?
Agile metrics and measurement imply the indicators that could help everyone in the system to get all the required information and also the insights that could help them in knowing:
- Is it really working?
- Are we going on the right path?
- Is it time to persevere, pivot, or decommission?
Plus many such questions that when answered, unravel the Why’s, What’s, How’s & When’s of the goal that we all are trying to achieve with our pursuit of agile. We will cover many popular agile adoption metrics for leadership in this blog.
Who are the Leaders in Agile Transformation and What Agile Metrics Define Their Success?
The magnitude of transformation varies based on the problems that businesses face and the business segment the company operates in. In service companies, the primary focus is to bring agility to the project & bigger programs at the level of teams or multiple teams who are delivering project deliverables in a typical T&M model. Transformation at such companies might not require too much scaling as the deliverables are client specific and dynamics will constantly change according to the urgency, technology constraints, resource capability based on the available bench, and other client-dependent aspects.
On the contrary, in the product environment, the focus is more on building new initiatives, maintaining existing codebase, building new features, upgrading infrastructure, and other such aspects.
To understand the metrics space effectively, let us categorize the leadership at 3 levels to further elaborate on agile metrics for leadership:
- Team level Leaders
-
- Here the leaders could be the Project Manager, Product Manager, Account or Delivery Manager, Engineering Manager, Product Owner, Scrum Master, and so on
- Program-level Leaders (multi-teams)
-
- Product Management group, Business Owners, Account Managers, Engineering Manager, Agile Coach, Solution Architects, and so on
- Portfolio or Business level Leaders
-
- Portfolio Managers, CXOs, VPs of Product, Engineering & others, Chief Architects, Transformation leaders and so on
Based on these two considerations, we will discuss:
- Agile Leadership metrics for leaders responsible for individual teams
- Agile leadership metrics for leaders who are responsible for Program teams or Agile Release Train
- Agile leadership metrics for Portfolio leaders or Executives who are responsible for Company Objectives fulfilment and continuous value delivery?
Agile Leadership Metrics for Leaders of Individual Teams
Few of the known agile metrics for leadership that are used at the level of the development team which is consumed and referred by the team themselves and also the leaders who are managing those teams for observing trends to understand execution certainty are:
- Burndown Chart
- Velocity Graph
- Control Chart
- Cumulative Flow Diagram
- Defect Removal Efficiency
- Commitment Variance
- Velocity Variance
- Agility Health Assessment
Let’s deep dive into each of these metrics.
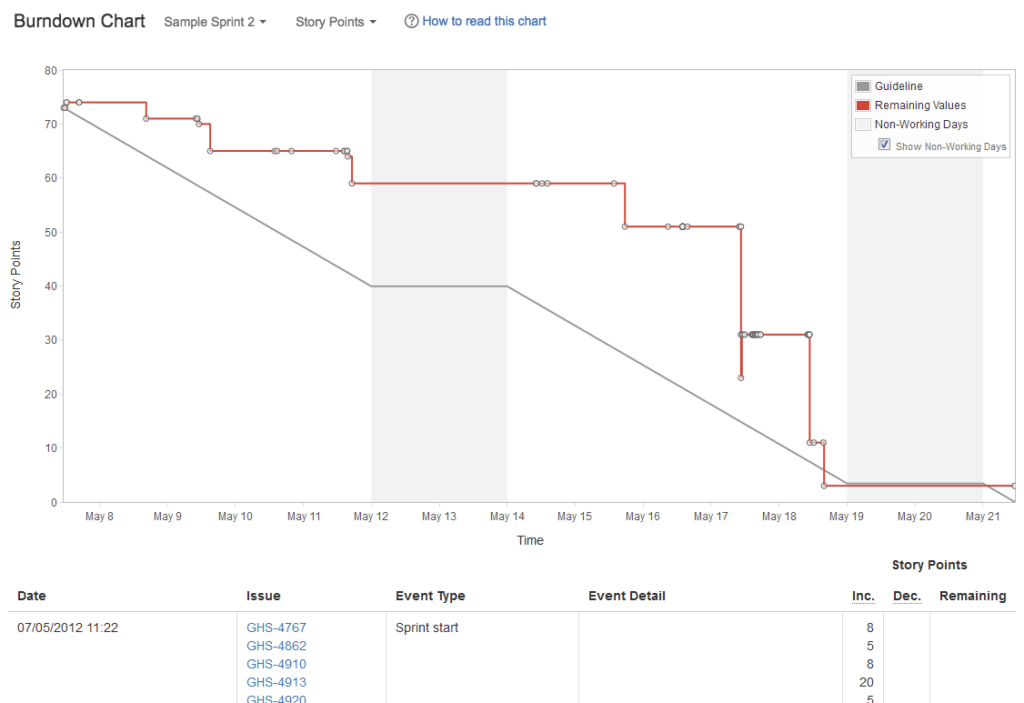
1. Burndown chart (To track the progress of work within an iteration)
The Burndown chart is one of the most used metrics to track the sprint-level progress made by the scrum team. It answers the question ‘How much work remains?’ every day. At the start of the sprint, the team forecasts the work that they could finish, the grey line in the below reference image denotes the ideal trend while the red line indicates the daily status of the work done. The red line could go down in 2 scenarios:
- When the estimated work is actually completed or moved to the Done state Or
- When we scope out the work from the running sprint (Be cautious of this scenario as it might happen that you may get influenced by the red line trend and skip the actual reason which could be tempering the committed scope of the sprint)
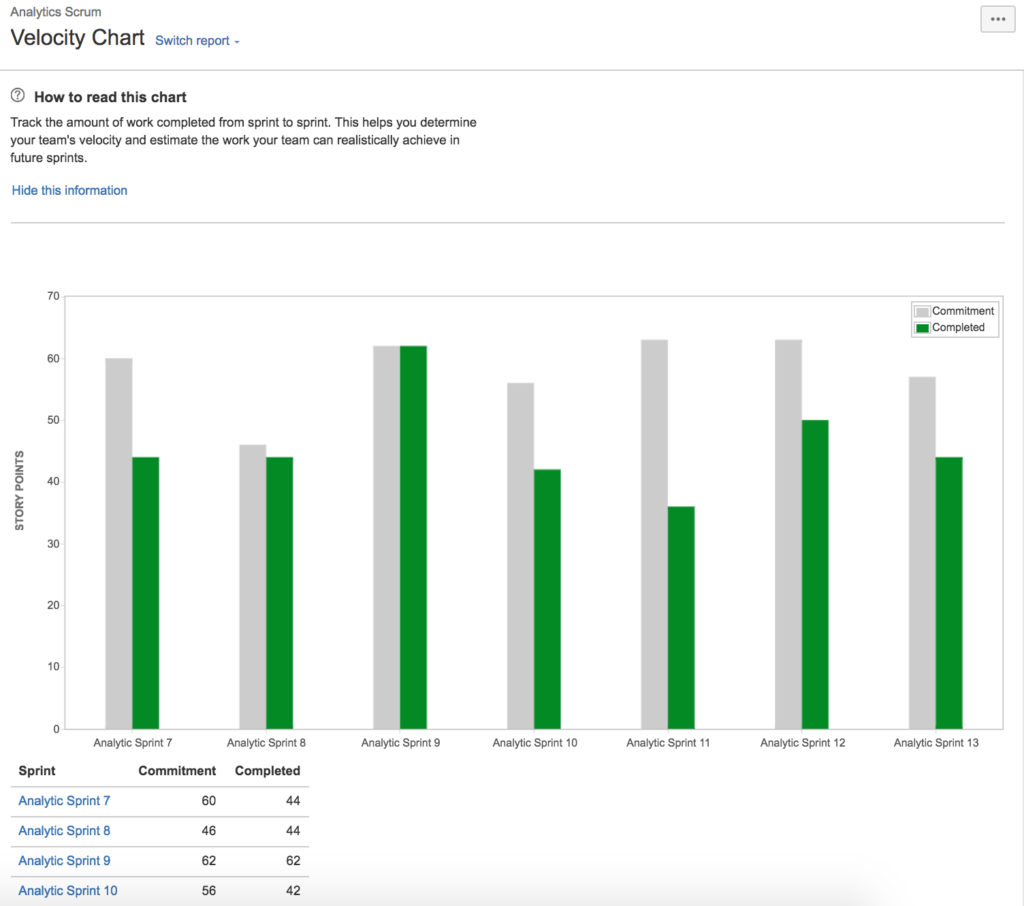
2. Velocity Graph (to understand the average throughput by team)
The velocity graph denotes the planned vs actual story points for each sprint achieved by the agile team. Velocity indicates the amount of work that a team can produce within an iteration. It is calculated by averaging the summation of story points of delivered items in previous 4-5 sprints. Velocity helps in measuring productivity and predictability of the team to commit new work that it is expected to deliver.
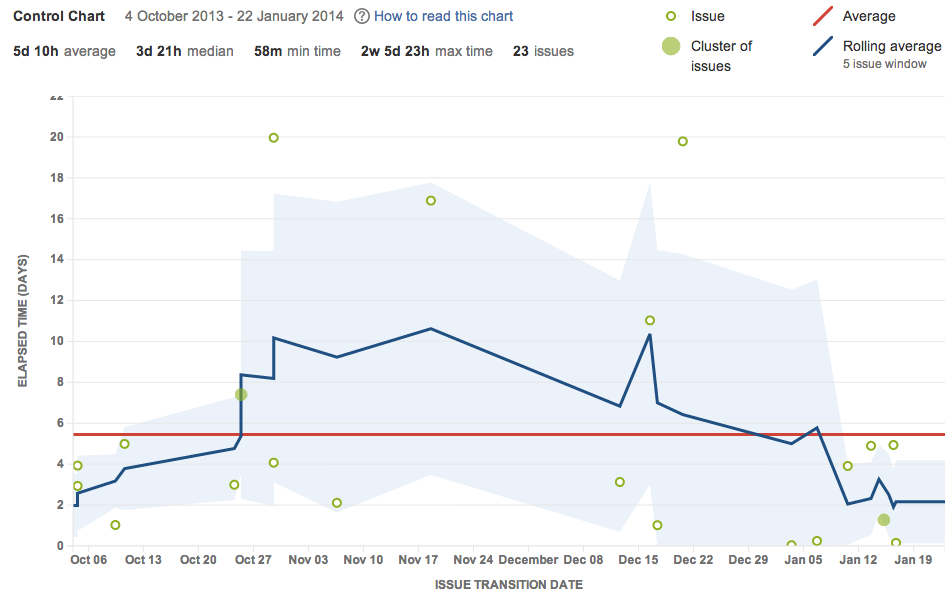
3. Control Chart (to measure the lead & cycle time)
If you want to know how much time does it take for any ticket to get completed then this chart is going to help you. Here we can measure 2 important metrics:
- Lead time – the time taken for a ticket to complete since it got added to your backlog
- Cycle time – the time taken for a ticket to complete since we started working on it
Using this chart, we could also know the fat that causes delays and work on it to make the end to end flow seamless.
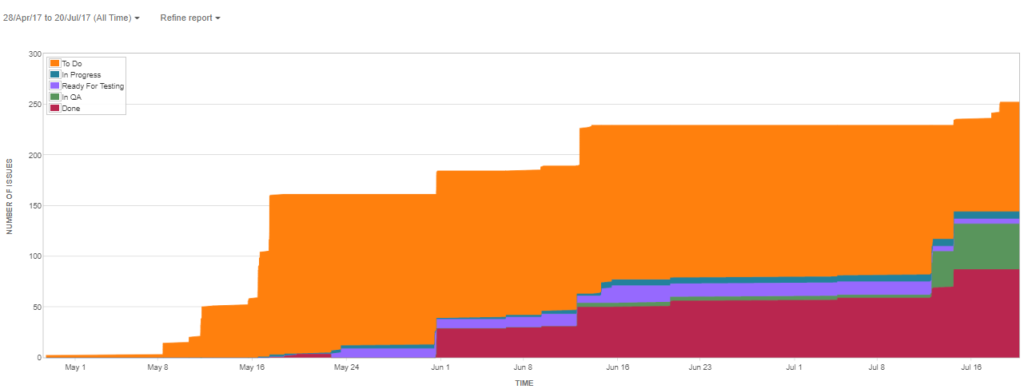
4. Cumulative flow diagram (to understand the load)
This chart will indicate the speed at which the work is getting added to your backlog and the speed in which we are pulling to implement it and marking it as done.
Even though the flow of your work has many states (like in development, testing, review etc), you can find in what state are we taking more time and where we are fast. Also, this agile metrics help us to take the critical decisions like adding more people or moving them to other projects or decisions like do we need to collaborate with input funnel stakeholders or exit-stakeholders with this rate and many more such insights.
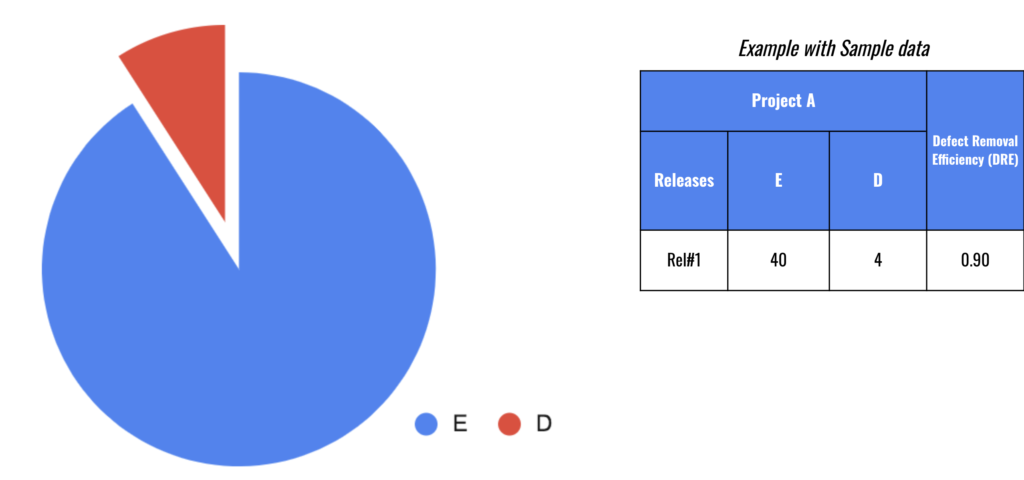
5. Defect Removal Efficiency (to validate the quality)
To know the quality of your go-live or production, this agile metric is very helpful. Using Defect removal efficiency, we find out the numbers of bugs identified in the production against the total number of bugs found in all the environments. The ideal benchmark that companies usually keep is around 95%.
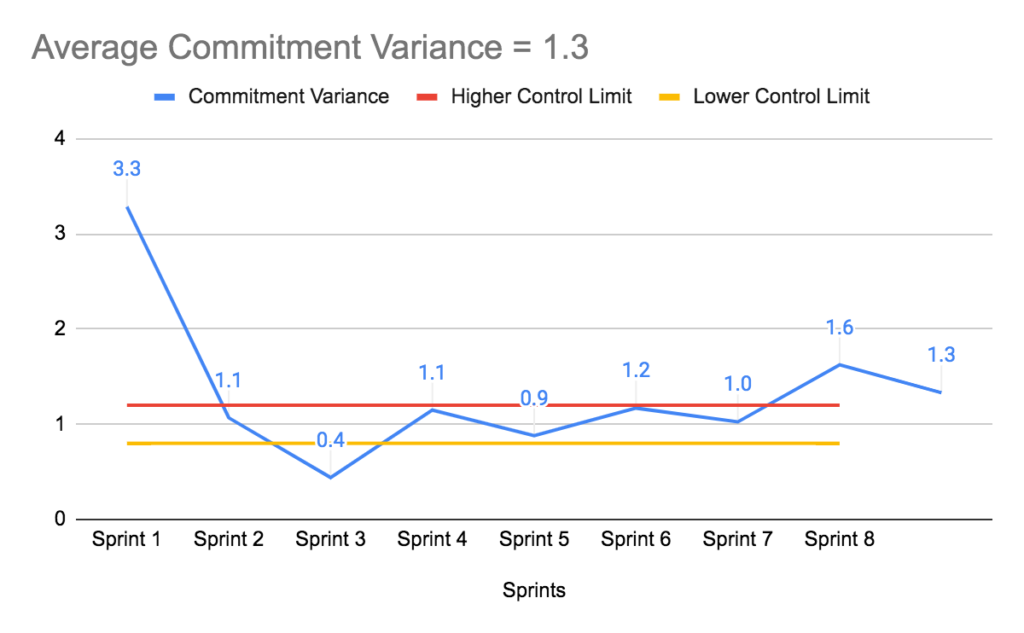
6. Commitment variance (to check the planned vs delivered per iteration)
Most of the scrum teams that we have worked with struggle to plan their work effectively and this is reflected in their throughput against what they have planned.
This metric will let you know the work delivered against the work planned for the respective sprint and then you can create a trend to observe the team’s productivity per sprint. In the below chart, we set a control limit to 80% achievement at the lower side and 20% additional work pulled at the upper side so as to identify the outliers and retrospect on opportunities of improvement, if any.
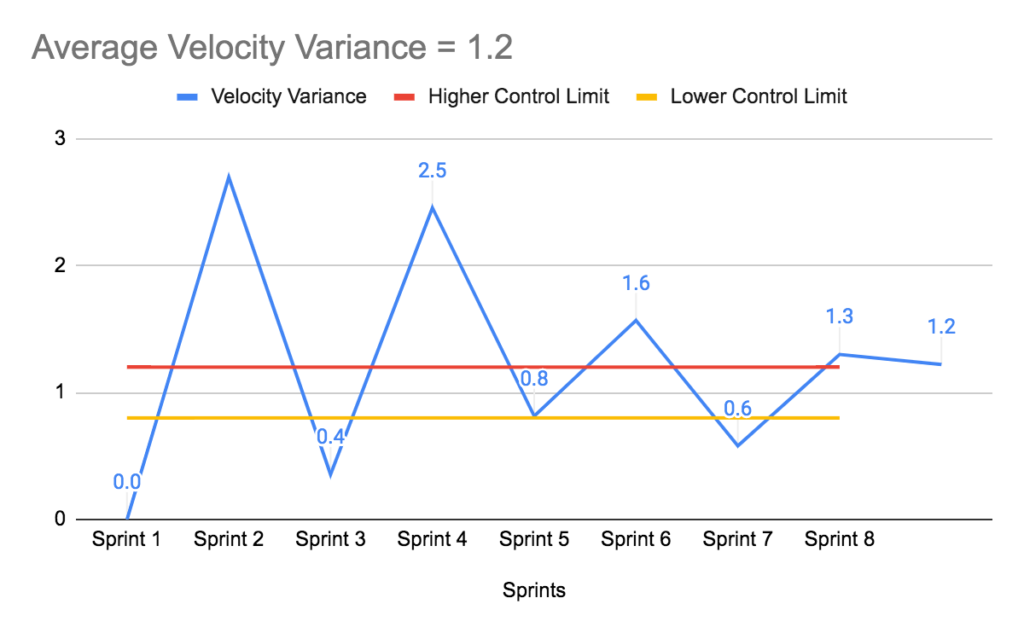
7. Velocity variance (to measure consistency of deliverables)
This Agile metric is used to understand the consistency of deliverables by an agile team against the timeline. Like commitment variance, the control limits are set. You may decide your limits accordingly.
The velocity variance is about the current sprint velocity against the average velocity. At some places, we measure it as, current sprint velocity against the previous sprint velocity. This helps us in knowing that, are we able to mark the work as DONE within the same sprint? or there is a spillover, which could be caused by the size of the work item or team’s running the sprints in a waterfall way or caused due to unstable allocation of resources and many more.
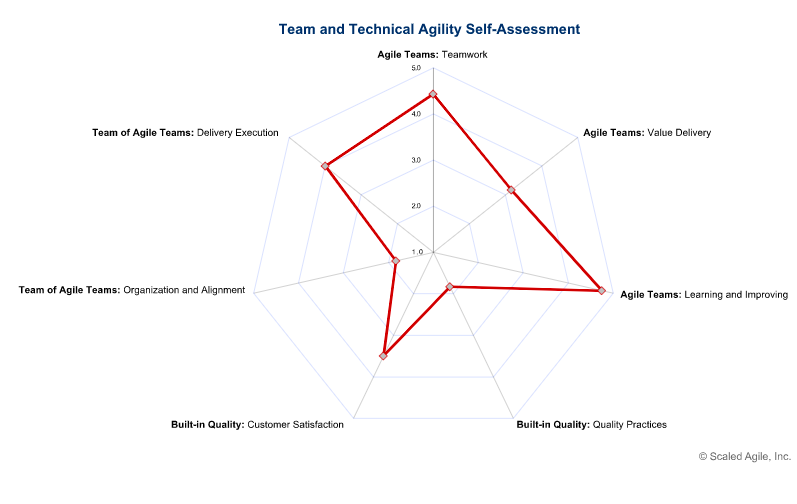
8. Agility Health Assessment (to measure agility of the team)
An essential agile adoption metrics for leadership to measure the agility of the team is also Agility Health Assessment. We use this extensively in our clients as an agile consulting company. This assessment is subjective to consultants who create or customise based on the client context and desired end goals of the Agile transformation.
Following are the steps that we recommend for conducting Agility Health Assessment:
- Observe the work environment where we are performing this assessment.
- Based on the observations, curate the survey that you will be using to conduct the agility health assessment.
- Segregate the focus areas, objective statements, subjective statements and also the time that a respondent will take to submit the survey. It must be simple, understandable and also very impactful at the same time.
- Book the appointment with team or teams who you want to assess
- During the assessment, explain the respondents the details of the survey and we always recommend to conduct the survey anonymously to let people open up without fear and bias
- Once you receive, the inputs, it’s time to analyse the survey responses
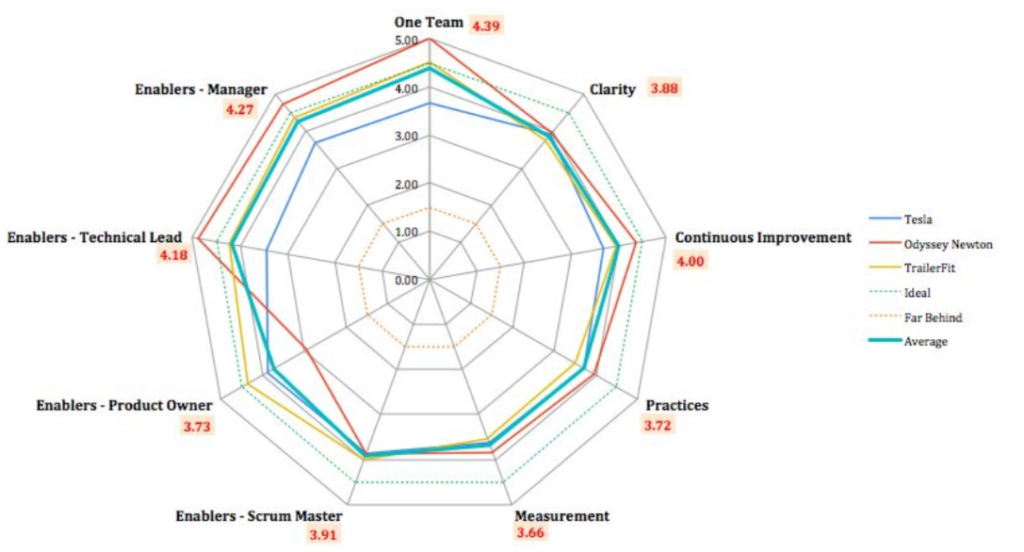
- Following analysis pointers could be used to consolidate:
- No of respondents
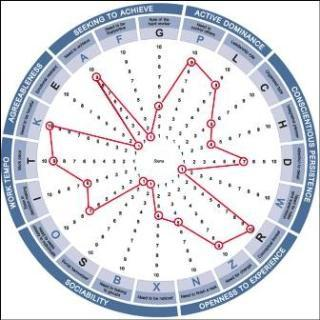
- A radar chart (like below) based on the average scores against each focus areas
- Top 5 statements (those with highest scores) denotes the key strengths of the team
- Bottom 5 statements (those with lowest scores) denotes the key opportunities of improvement for the team
- The statements that have got similar or same scores from respondents showcases the Top Consensus
- Likewise, the statements that have got different scores denotes Top Divergence
- Compare the patterns among multiple teams and try to find common strength & weaknesses
- Ensure the sanctity of the data
- Present the analysis to all the respondents and the leadership
- Collect everyone’s input
- Prepare the growth plan with all the respondents on top 3-5 areas of improvements for a quarter
- Identify the owners for each growth item
- Ask for their action plan
- Ask for the probable date for accomplishing them
- Repeat this, every quarter and incrementally help your teams to grow
Reference: Scaled Agile Framework website
There could be many more other agile metrics for leadership at the individual team level like Epic Report, Version Report, Scope Creep, etc. also on a case-by-case basis.
Agile Metrics for Leadership: Key Metrics for Leaders of Program Teams and Agile Release Trains
When we scale agile transformation using SAFe as a framework, we use metrics to track progress at the Planning Interval level (PI) across the ART (Agile Release Train).
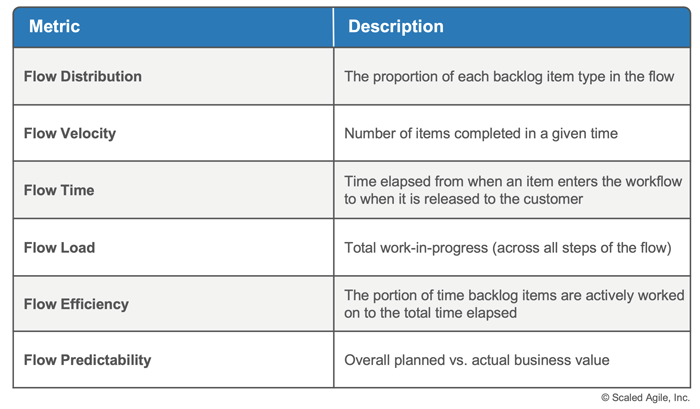
These agile flow metrics for leadership focus on the level of programs, some of them are:
- Flow Distribution
- Flow Velocity
- Flow Time
- Flow Load
- Flow Efficiency
- Flow Predictability
Scaled Agile Framework (SAFe) website.
Let’s understand each of them in detail.
1. Flow Predictability (to check the consistency of ART teams in delivering committed objectives)
Across the planning intervals, when we want to know the delivered outcomes against the planned as a group of teams consolidated as a Program Team or ART (Agile Release Train), then this chart will help us in knowing the predictability of outcome this ART/Program team could achieve in future planning intervals or quarters.
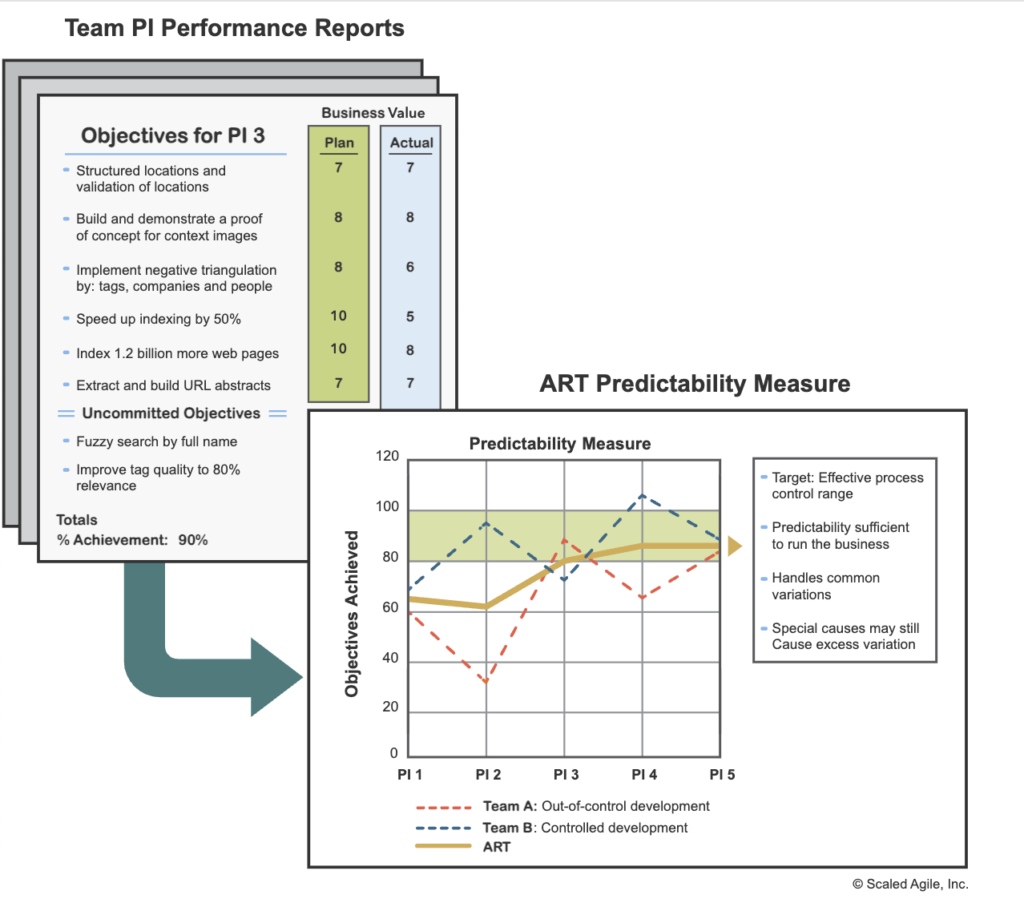
Reference, Scaled Agile Framework (SAFe) website.
2. Flow time (time taken by a given work item to complete)
As the Program team or ART grows, there are multiple hand-offs. Flow time helps us in knowing the time when the ticket was created till it gets resolved or closed. The higher the time, the more we are making customers wait and it will impact their experience and also our business continuity accordingly. The idea is to make the flow of value as seamless and fat-free as possible within our constraints.
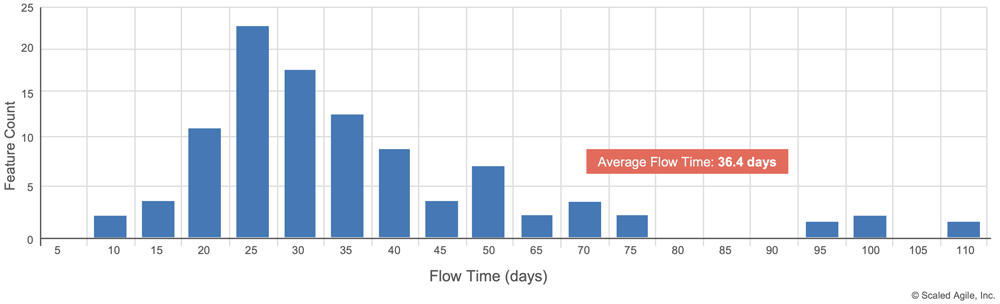
Reference, Scaled Agile Framework (SAFe) website.
3. Flow distribution (proportion of work items types within PI plan)
Flow distribution talks about the categories of work that we consider in our quarterly plan or planning interval (called PI). A good balance is the key. If we invest more in Features then it may lead to adding complexities to our code or tangled architecture. The platform will also get affected with such load as it may not be tuned for that. If we invest too much in Enablers then possibly our customer might experience a delay in meeting their demands and the competition could get an edge. Hence, all the factors must be considered in deciding the distribution of work that we are positioning for our teams to handle.
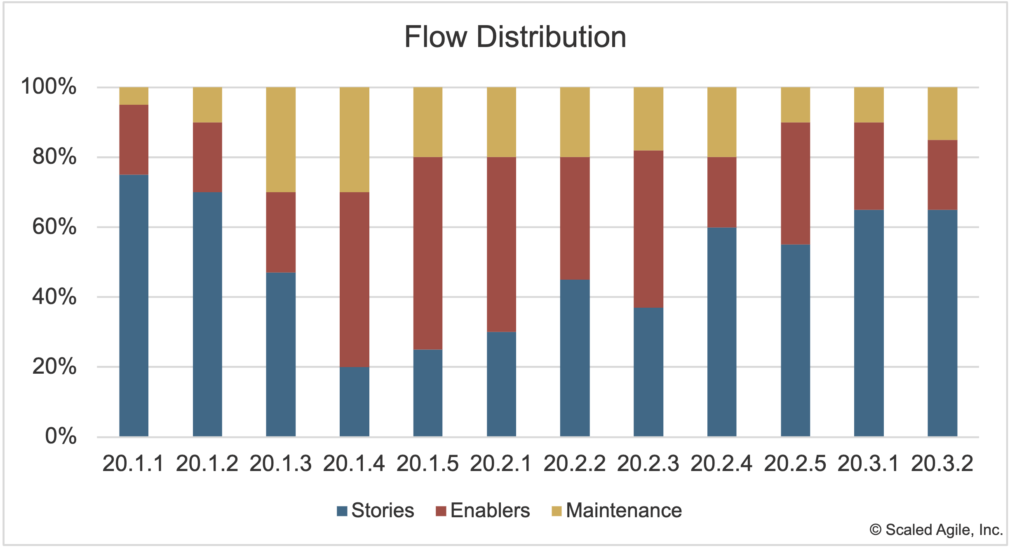
Reference, Scaled Agile Framework (SAFe) website.
4. Flow Velocity (at any given time, to know the completion of work items by the team to understand productivity)
Flow velocity helps us in understanding the productivity of the entire program team or ART in each development iteration. A good sense-check to analyze the delays or potential mismatch in planned vs actual delivery.
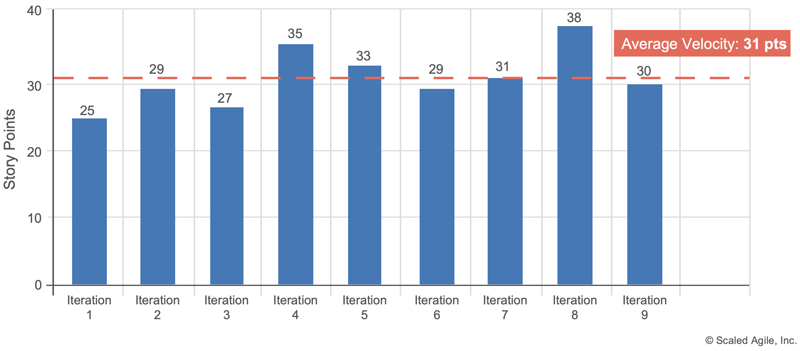
Reference, Scaled Agile Framework (SAFe) website.
5. Flow Load (to know the work-in-progress at any given time)
Flow Load provides various insights like:
- Do we have sufficient work for the team?
- Is the work getting stacked in the input queue (say ‘Funnel’ column) and hence each ticket is getting delayed in delivery due to a lack of resources?
- Which aspect of flow (ex. Implementing or Validating on Staging) is taking the most time or fast (ex: Deploying to Production, Refactoring)?
- At what stage were we performing well and vice versa?
- And many more.
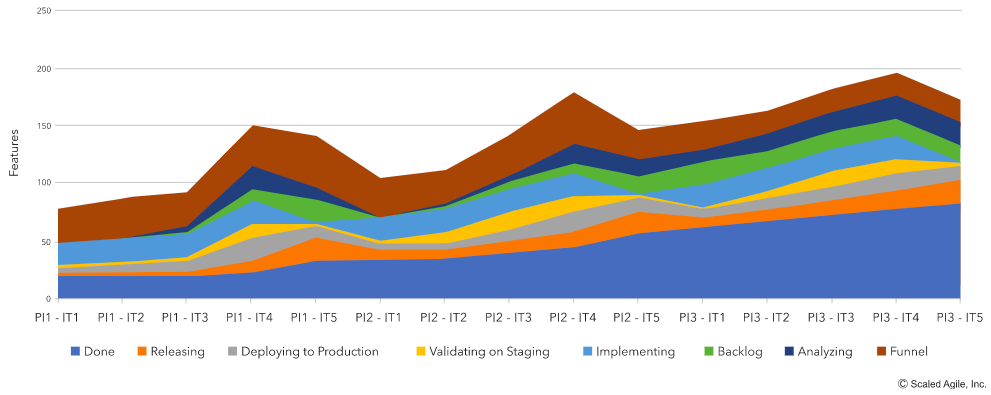
Reference, Scaled Agile Framework (SAFe) website.
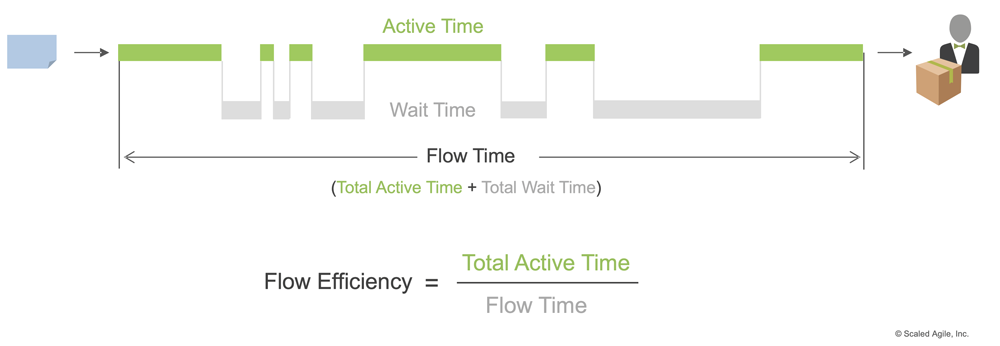
6. Flow Efficiency (to understand the time spent on value-added items against the total time taken)
The goal for any business is to address the business needs at the earliest and with the best quality. This agile metric will help us in understanding the lead time and cycle time. The total active time is identified by removing the wait time from the total flow time. The faster we become, the sooner the value will reach the customer.
Reference, Scaled Agile Framework (SAFe) website.
Agile Leadership Metrics for Portfolio Leaders and Executives Responsible for Fulfilling Company Objectives and Ensuring Continuous Value Delivery
The leaders who manage the progress at the Portfolio level will find agile metrics focused on measuring business performance and overall impact in terms of revenue realization, customer satisfaction and so on to be useful. Here are a few examples of agile business value metrics for leadership, portfolio leaders, and executives:
- Value Stream-Specific KPIs
- OKRs or Objectives & Key Results
- Average wait time
- Time ‘in the zone’
- Holding cost vs Transaction cost
- DORA Metrics
Let’s dive into the details of these agile metrics for leadership.
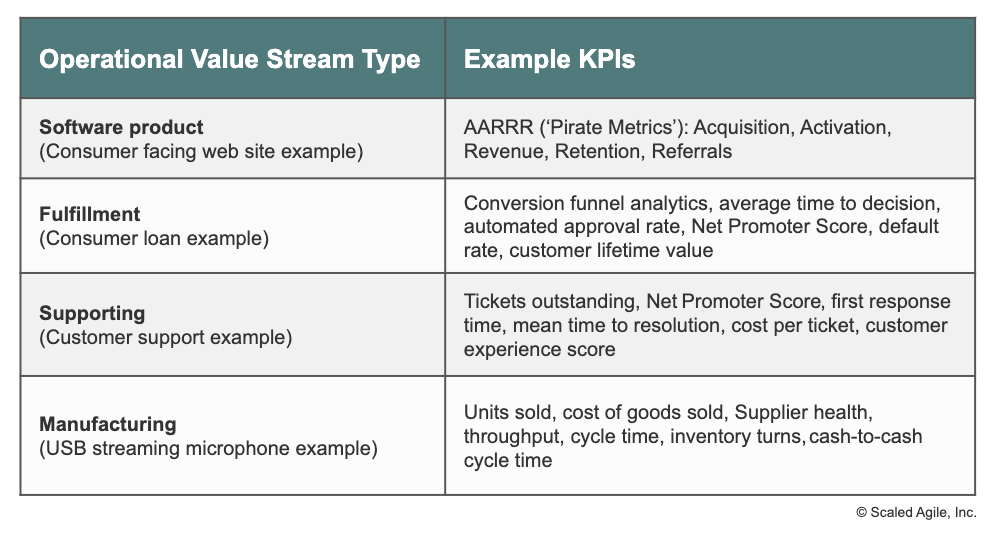
- Value Stream-Specific KPIs
The senior leadership executives operate primarily at the strategic theme which is focused on continuous value delivery to customers, business growth, operational efficiency, and seamless execution apart from many other concerns like competition, changing trends, cost effectiveness, etc.
To manage these business priorities effectively, the key focus should be on maximizing the efficiency of the operational value stream and the table below showcases a few of the metrics that will help agile leadership measure the value that matters most to their business.
Reference: Scaled Agile Framework website
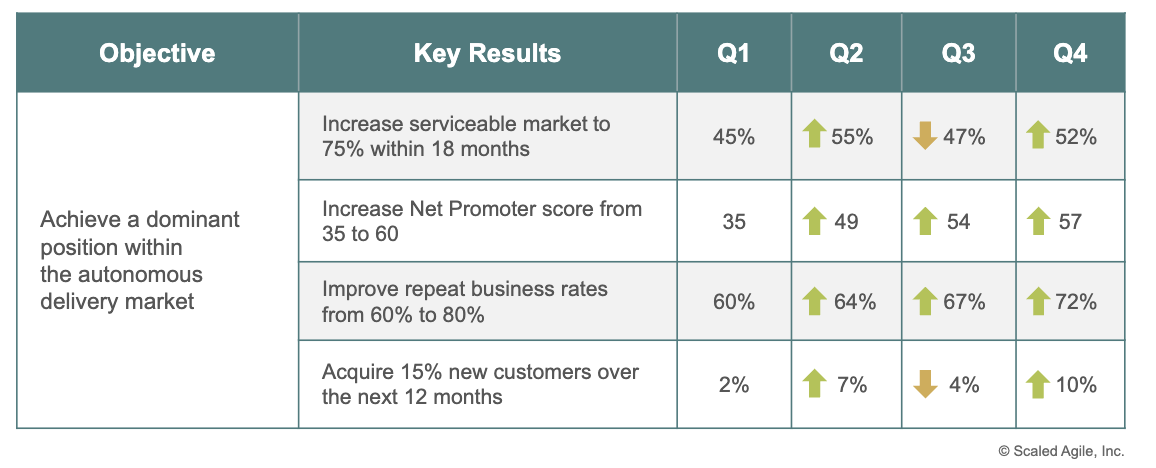
- OKRs or Objective & Key Results
OKRs or Objectives & key Results help leadership translate their strategic themes to objectives that could help in contributing to the vision & mission of the organization and track measurable key results which when fulfilled, will help in the completion of those objectives.
These objectives are meant to be inspiring and at the same time challenging. The key results act as guidance for the implementation team and they identify initiatives to fulfil them. To know if the objectives have been achieved, we use KPIs. KPIs are constant and with the favorable change in their values, we could see the actual impact happening. OKRs could be implemented at the level of Portfolio or a higher level like Strategy, Program, or Group level & also at the level of Teams. We have observed a few organizations also doing it at an individual level.
To know more about OKRs and how to implement them, check our OKR consulting page.
Reference: Scaled Agile Framework website
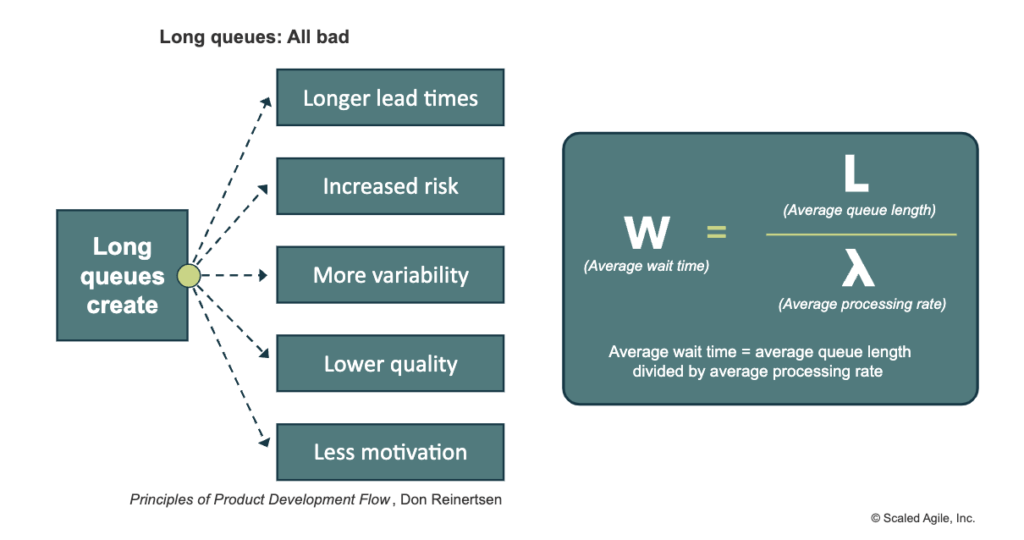
- Average Wait Time
One of the most negative points for any business is long queues causing wait due to which we have delays in customer delivery. Average wait time metrics can be leveraged to identify the waste that we have in the end-to-end flow, identify the opportunities of improvement, and then identify the actions that could be taken to remove the waste. The overall goal is to be able to achieve a fat-free system.
Reference: Scaled Agile Framework website
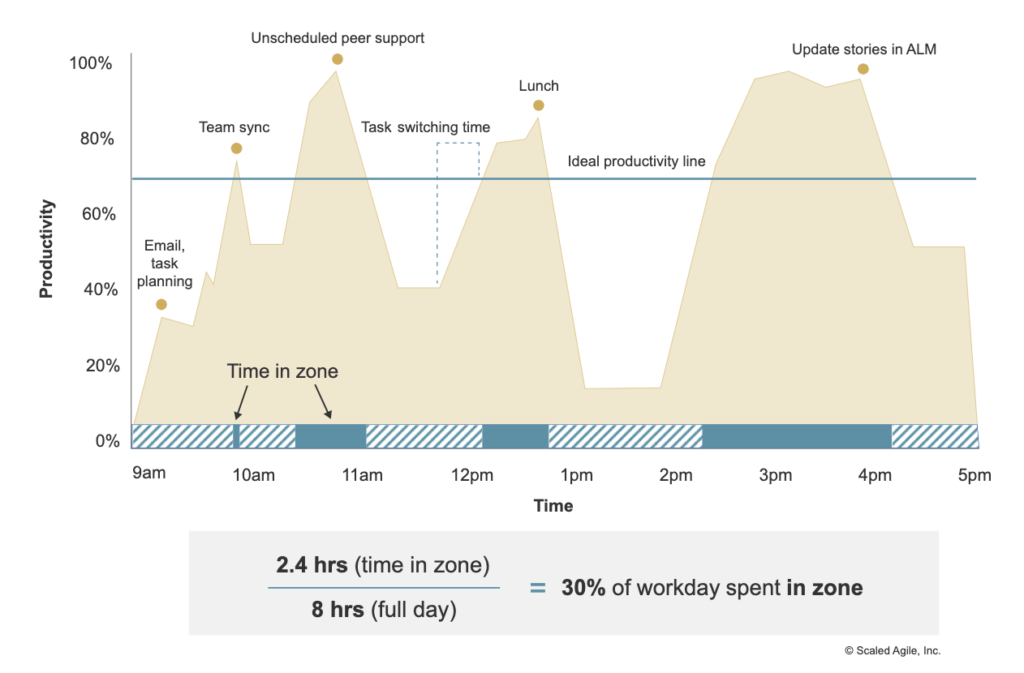
- Time ‘In the Zone’
For resource efficiency or improving productivity, the leaders want to know the productive time that an individual spends within a day. This way, we can identify and champion policies across the organisation to increase the focused time by eliminating redundancy or tuning the processes to bring the ‘in the zone’ focus.
Reference: Scaled Agile Framework website
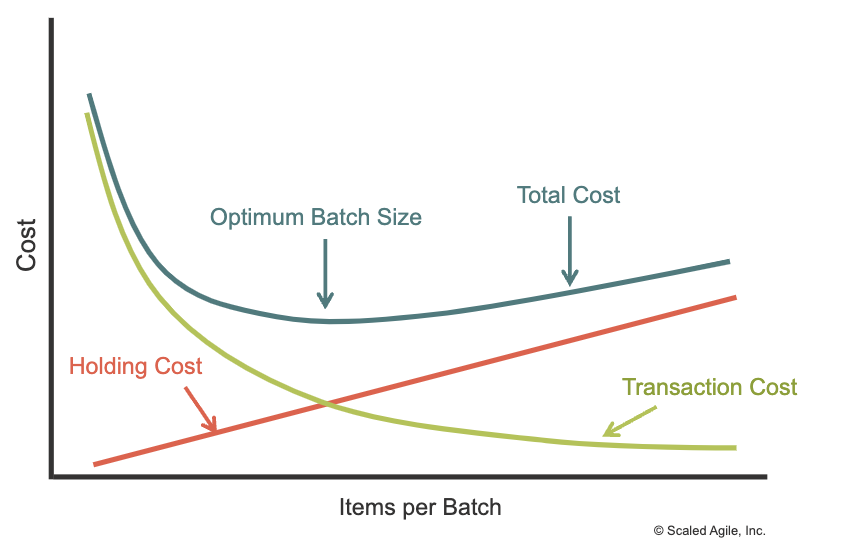
- Holding Cost Vs Transaction Cost
The economically optimal batch size depends on the holding cost (the cost for delayed feedback, inventory decay, delayed value delivery, and so on) and the transaction cost (the cost of preparing and implementing the batch). There is a need to factor in the holding cost, reduce the transaction cost, and keep a check on the batch size.
Reference: Scaled Agile Framework website
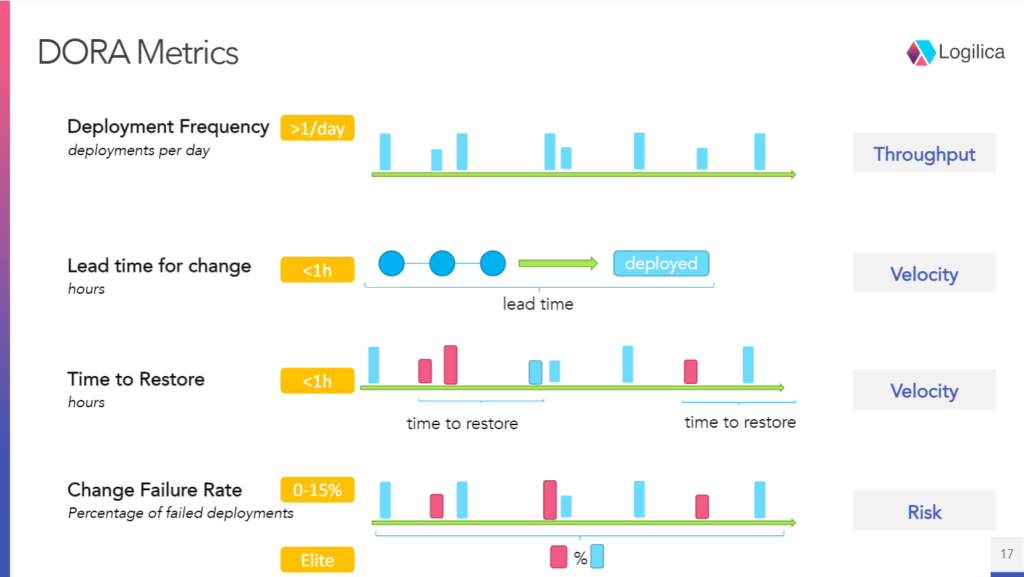
- DORA metrics
In the past few years, DORA metrics have been a common measuring criteria at most of the IT firms that are focusing on rapid development and catering to numerous customer demands at a high pace. DORA stands for DevOps Research and Assessment. DORA is a startup created by Gene Kim and Jez Humble with Dr. Nicole Forsgren at the helm. The startup identified four key metrics — the “DORA Metrics” — that engineering teams can use to measure their performance in four critical areas. These metrics are:
- Deployment Frequency, or how many times a day code is deployed to production,
- Lead Time for Change, or how many hours it takes from starting an activity (like resolving a JIRA ticket) to production,
- Time to Restore Service, or how many hours it takes to recover from a production failure,
- Change Failure Rate, or how many deployments go wrong in production.
Reference: https://platformengineering.org/
How to Measure Leadership Growth?
Leadership growth is a complex topic needing long-term commitment and organizational focus. Leadership growth is based on inculcating the following traits:
- Being open-minded
- Embracing changing dynamics in the VUCA world
- Situational awareness
- Being Business ready
- Clarity of vision, mission & ensuring everyone knows about it
- Commitment to People Growth
- Promoting a sense of ownership
- Inculcating one team mindset
- Encouraging Inclusivity
- And many more..
We suggest competency parameters from a framework like PAPI 3 for leadership assessment. PAPI 3 (Personality and Preference Inventory) is a tool that measures behavior and predicts performance based on individual differences by assessing candidates/employees/leaders based on the following dimensions:
- Organisation & Structure
- Impact & Drive
- Engagement
- Composure
- Work Momentum
- Interaction
- Ideas & Change
PAPI 3 is based on the different factors of personality which includes Openness to Experience, Conscientiousness, Extraversion, Agreeableness, and Emotional Stability.
Which Agile Metrics Are Right for You?
Peter Drucker’s famous aphorism which says “what gets measured, gets managed” has been deeply ingrained in many organizations at all levels. This has been misused widely in organizations and has led to manipulation, projecting a false sense of control and believing that everything that counts must be counted.
We believe that one should learn to zoom in and zoom out all the time to think about the following critical questions:
- To make decisions for the betterment, what all insights do I need?
- To understand the gravity of the situation, am I looking at the right information?
- If the books are saying that we are growing then why are we still hesitating to take actions?
- How long could we last if we stop innovating today?
- And many more..
So, our recommendation is to carefully understand these 5 tenets to decide the metrics that you want to use for your business:
- People
- Process
- Product
- Technology
- Client
Dynamics change even if one of them is different from your current experience where you have benefited from certain metrics.
How to Avoid Common Mistakes in Agile Leadership Metrics
The common mistakes that we have observed leaders making when using agile metrics for making decisions are:
- Using what we know and not what is needed
- Not considering the dependent factors due to which the results are either fulfilling or adverse
- Not looking at the subjective aspects and only making decisions based on objective measures (Nuance is important)
- Ignoring trends due to existing bias
- Lacking the courage to make decisions just because your metrics say so
- Punishing people based on short-term failures
- Not reviewing the root cause that impacted such results
How Do Consulting Firms Help Companies Align with Agile Metrics?
Benzne as an agile transformation services company has served a multitude of leaders and their teams working on complex projects belonging to different segments and over the course we have figured out that there is always appreciation for a new set of eyes (an outside in perspective) to navigate the stagnant ways of working caused by an overwhelming inside-out perspective if the leaders have to stay relevant in the game.
We kickstart most of our engagements with As-Is analysis where we meet people, understand their process, deep dive into their product, learn their customer base, and also the technology that they are using to fulfill the demands. Based on that we understand the level of insights that are required at all levels and what are the key problems that are required to be solved in consensus with the internal team.
We bring in a data-driven approach to understand the current situation and recommend potential solutions that can be brought by using the right set of agile transformation metrics that could improve the overall experience in terms of decision-making, drawing strategies, and identifying the key change within teams, programs and organization.
Recommended Read
Conclusion
With this our blog on ‘Agile Metrics for Leadership’ comes to an end, while there are hundreds of agile metrics and measurement tools for leadership available across the globe including both generic ones and specific to industries, we have covered a few of the most relevant agile metrics examples that leadership can benefit from based on our experience and we are open to hear your feedback and what has or has not worked for you in the past. We look forward to collaborating with you to support and add value to your agile transformation journey which leads to business growth by reducing bottlenecks. Write to us at consult@benzne.com to learn more about our experience with these metrics and discuss how we can implement them in your business.
Frequently Asked Questions About Agile Metrics For Leadership
1. What are the most common metrics in agile?
The most common metrics in agile are primarily focused on measuring the progress at the level of teams:
- Burndown chart to seek day-to-day progress & determine the amount of work remaining
- Velocity, to determine the productivity of the team to know how many sprints will the team take to finish remaining work or plan for new work
- Lead time, to determine the end-to-end time taken to finish the work
- Cycle time, to determine the time taken to finish the work from the point when any work started on it
2. What is the best measure of Agile leadership?
A good agile leadership helps the organization and its team to continuously be better version of themselves to excel in a constantly changing environment. To check how agile our leadership is, we should identify metrics that should measure:
- How soon do we deliver value to customers?
- Along with making customers happy, are we also taking care of business viability and the long-lasting trustworthiness of the platform/product
- Are we failing sooner or later?
- Are we accommodating changes?
- Fulfillment of vision & mission
- Overall growth including customer satisfaction and employee satisfaction
- A healthy work environment with minimum bureaucracy which is more inclined towards self-organising and a one-team mindset
3. What is KPI in Agile?
KPI is not a term in Agile, as it is a measure of the fulfillment of one’s objectives. In terms of business, it could be customer satisfaction, employee retention, new customer acquisition, cost reduction, revenue growth, etc. In terms of personal growth, it could be appropriate BMI for measuring health, financial goals determined with monetary aspects and things like that.
4. How to measure KPI in Agile?
For a project to be successful, according to the typical project management practice, we aspire to do everything to ensure that we finish all the committed work within the set timeline and budget, that too with good quality and no concern areas. We have covered some of the typical agile metrics for project management along with the tools in this blog.
The times have now changed. The requirements are continuously evolving, there are new evolving technologies to cope up in the digital age, and on top of that we need to deliver demands continuously, again with good quality and no concerns. So, KPIs shouldn’t be set at the level of an initiative as fulfilling an initiative doesn’t guarantee that in coming weeks or months it is still relevant for the set objectives. Hence, we recommend that KPIs should be set at the level of objective itself.
Another example, if an objective is ‘Our product should always be available to our client’. Here the KPI would be to have 99.999% uptime of systems. For which we may need different monitoring tools which continuously track the vulnerabilities and teams working in shifts to resolve them. There should be complex systems in place to roll back deployments if they are failing the objectives. Now to attain such KPI, agile teams will keep on upgrading their systems, parallelly delivering new features and also scaling while at the same time being cautious to not break the stability of the system.
5. How do you measure organizational leadership?
Organizational leadership has a key responsibility of fulfilling the vision, mission, and OKRs driven by strategic themes. Their fulfilment is key to measuring their success but it doesn’t stop here. They need to inspire the workforce, own the outcomes, have a roadmap that’s evolving, and continuously grow to sustain in ever-changing market trends and rhythms. To check and monitor all these, we have suggested a few metrics that could help the leadership in spearheading critical initiatives along with their teams to grow the business indefinitely.
