

Agile transformation is a journey which organizations take to help teams move towards better and relevant ways of working. Two of the main mindsets of agile are “Inspect and adapt” and “Continuous Improvement”, agile transformation also follows the same principles where teams and businesses lay out a plan for the transformation and pivot based on the inspection.
Organizations move towards agile adoption with a purpose driven by the need to improve the way of working, making business leaner, changing the culture of the teams, delivering modern solutions faster etc.
There are three obvious questions that come to mind once any transformation is decided:
- Why are we doing this transformation?
- What are the outcomes we want to achieve?
- How are we achieving it?
While these are the questions which surface during decision making, there is another important question which comes when we start the execution and that is “How are we progressing?” That’s where Agile transformation metrics play its part and is so important for leadership to understand and leverage.
Agile transformation success metrics are the insights which help business and coaches to understand the team’s efficiency, value delivered, gaps and antipatterns and shift continuously towards agility in delivering quality and outcome driven product.
Why are agile transformation metrics important?
People, process and product are three pillars to any organization to deliver value to their customers. Unlike conventional methods of delivery, where the emphasis is on the output, agile revolves around outcomes delivered continuously.
Against setting a benchmark and monitoring metrics to see if we are reaching it, agile promotes analyzing the metrics and then working towards improving. This is a shift organizations need to make in the way we look at metrics.
Agile transformation metrics are not a target, rather they are insights into how the teams are performing, how value is getting delivered, and how efficient is our process.
In an agile environment, there are people who need to adapt to changes, there are practices / processes which need tweaking, there is a product which needs to be delivered continuously in chunks, and all these aspects need to be inspected and pivoted while keeping the following pointers in mind:
- How do we inspect?
- How do we know if the business/ teams are moving towards the outcomes of the transformation?
- How do we ensure if the organizations are reaping the benefits of the transformation?
- How do we measure the agility of the teams & businesses?
- How to identify gaps and overcome them?
This is where metrics for agile transformation come into picture which is a reflection of how teams are delivering value to the customer, how people are changing the way they work, how process is helping teams and a lot more.
Types of Agile Transformation Metrics
As mentioned above, an agile environment involves people, process, product and the customer. Hence a shift in the way we work, plan or deliver in all these aspects becomes important. Agile transformation metrics can be broadly classified into following buckets at a high level:
- Business & Customer centric – Is your agile transformation increasing your customer satisfaction? Is your business now faster in responding to market needs? Are your customers endorsing you to other customers?
- Process & Practice centric – Is there a culture of continuous improvement in your teams after the transformation? Are your teams responding to change? Are your customers getting value delivered continuously? Are your teams innovating enough to develop modern solutions?
- People centric – Is there a culture of transparency within the teams? Are your teams happy and content with the work? Are your teams self motivated? Are the role expectations set properly? Are your teams having a continuous learning mindset?

While these buckets are at a high level and the questions reflect the intent for inspection, there are several metrics for agile transformation which will give us the insights to improve continuously.
Levels of agile transformation metrics
Agile Transformation metrics can give insights at all the levels of an organization. While the end goal of the transformation is to achieve organizational agility, inspection and pivoting has to be done at all the levels continuously. Else there could be a lot of bottlenecks resulting in chaos in the system. We also need to understand that there is no one best metrics for agile transformation and what we select to measure will depend on the business context, our present state and where we want to be.
We will discuss the following pieces of agile transformation metric canvas in detail in this blog:
- Top-level agile transformation performance metrics
- CSAT & NPS
- Speed of Value Delivery
- Worker’s Happiness / Employee Satisfaction Score
- Psychological Safety
- Agile Transformation Metrics For Executives & Business
- Sprint / Team Level Metrics
- Burndown Chart
- Velocity Chart
- Commitment/Productivity Variance/ Planned to Done Ratio
- Release / Program Level Metrics
- Epic Burndown Chart
- Version Report/ Release Burndown Chart
- Control Chart
- Cumulative Flow Diagram
- Business Value Delivered
- System Level & Quality Metrics
- Code Coverage
- Failed Deployments
- Blocked Time
- Defect Removal Efficiency
- Innovation Metrics
- Sprint / Team Level Metrics
- Business Metrics
- Purpose and Vision
- OKRs
- Spike in Revenue
- Reduction in Operation cost
- Churn rate
- Customer retention
- Net promoter Score
- Customer Satisfaction
- Employee Engagement
- Conduction Agility health assessments
- Niko Niko calendars
- Employee Satisfaction Score
- Continuous Improvement
- Lead time and Cycle time
- Defect Removal Efficiency
- Failed Deployments
- Agility health assessments
- Productivity
- Velocity Chart
- Lead time and Cycle time
- Control chart
- Cumulative flow diagram
- Epic and release burndown chart
- Team burndown chart
- Purpose and Vision
- Predictability
- Program predictability measure (PPM) at a program level
- Epic & release burndown chart at a release level
- Velocity chart at a team level
- Lead time at a release & team level
- Burndown chart to predict the sprint success
- Quality & Speed
- Lead and Cycle time.
- Code coverage, Failed Deployments, Escaped Defects, Defect removal efficiency
Navigate the complexities of agile implementation with expert consulting. Drive successful adoption and maximize results. Discover our solutions today.
Top-level agile transformation performance metrics
Customer Satisfaction & Net Promoter Score
What? Agile ways of working emphasize close interactions and collaboration between customers and development teams. This approach enables teams to identify and address customer needs early on and make adjustments as necessary to ensure that the end product meets the customer’s expectations.
How? To measure customer satisfaction in the Agile methodology, a wide variety of techniques can be used supported by multiple tools. Some of the mostly used techniques include:
- Surveys – These can be conducted online or in person and can be used to gather data on specific aspects of the product or service, such as ease of use, reliability, and overall customer experience.
- Customer feedback calls / sessions – In these sessions, customers are given the opportunity to provide direct feedback on the product or service, including what they like, what they don’t like, and what they would like to see improved.
- Net Promoter Score – Net promoter score shows whether your customers or users are willing to recommend your product or services to their friends or customers

Speed Of value Delivery
What? Agile ways of working promotes faster delivery. This is done by delivering smaller chunks of high value work prioritized , developed and released frequently.
How? Two direct metrics which can help teams and businesses to understand the speed of delivery are Lead and Cycle time.
- Lead Time – Lead time shows you the total time a work item takes in the entire process from the moment it is requested to the time it is delivered.
- Cycle Time – Cycle time tells us the total time a work item takes from the time teams start working on it till is delivered to the customer

Worker’s Happiness / Employee Satisfaction Score
What? Agile teams are built around self motivated individuals. A frequent check on how motivated the team’s members are, how safe are they feeling to talk freely within the team? Are some of the criterias on which the assessment can be done.
How? Again, to measure employee satisfaction in the Agile teams, a wide variety of techniques can be used supported by multiple tools. Some of the mostly used techniques include
- Surveys – These can be conducted online or in person and can be used to gather data on specific aspects of how safe the team members are feeling, how satisfied they are with the work, how freely can they share their opinions, etc

Psychological Safety
What? Psychological Safety is a feeling of an individual or group of people where one can talk freely, share suggestions and opinions without being judged and take risks without being punished. Psychological safety is a key essential for high performing teams.
How?Again, to measure psychological safety in the Agile teams, a wide variety of techniques can be used supported by multiple tools. Some of the mostly used techniques include
- Surveys – These can be conducted online or in person one on one and can be used to gather data on specific aspects of how safe the team members are feeling.
- 1 on 1s – A dedicated external help can be sought where team members can open up and give unbiased data to derive the metric
- Use of feedback / grievance boxes
- Reduction in attrition rate
Agile Transformation Metrics For Executives & Business
Sprint / Team Level Metrics
Burndown Chart
One of the most popular quantitative Agile metrics, the sprint burndown chart, is used to track the amount of work left in a particular sprint.

- X Axis represents the days in the sprint
- Y Axis represents the story points committed in the sprint
- There is a gray line which is plotted automatically by JIRA which shows us how the team should ideally burn the story points
- Any story which moves to the last column the appropriate story points are burnt in the graph
- Any particular time or day when we see the chart, the question to be asked is “ How Much Work Is remaining?”
- If we are above the ideal grey line, that means we are lagging behind and we need to plan the rest of the days better
- If we are below the ideal grey line, it means we are ahead of what we had planned to deliver

Velocity refers to the amount of work a Scrum team can finish in a sprint.
- Higher velocity implies a higher output
- Significant drops in velocity highlight problems that require investigation.
- Varying velocity of the team also highlights a buried concern and it’s time to talk to the team and investigate it

- Shows how committed the team is in delivering what they have planned at the start of a sprint.
- The avg deviation of 10~15% lower and higher side is not a concern but if it is more than, it requires investigation.
Release / Program Level Metrics
Epic Burndown Chart
This report shows you how your team is progressing against the work for an epic. It’s optimized for Scrum teams who work in sprints and makes tracking easier.
- See how work added/removed during the sprint has affected your team’s overall progress.
- Predict how many sprints it will take to complete the work for an epic, based on past sprints and changes during the sprints.

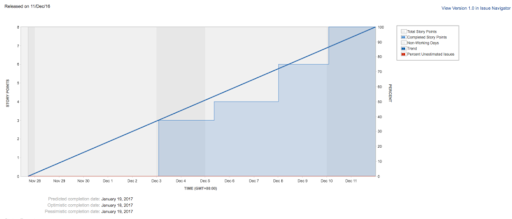
Version Report/ Release Burndown Chart
- This helps you monitor whether the version will release on time, so you can take appropriate action if work is falling behind.
- This report is an automated report in JIRA and helps track the projected release date for a version.
Control Chart
- It shows the cycle time for your features. This helps to identify whether data from the current process can be used to determine future performance.
- It gives us insights of visibility, efficiency and predictability that helps us to understand which is our bottleneck and what action needs to be taken.

Cumulative Flow Diagram
The Cumulative Flow Diagram shows the quantity of work in a given state, the rate at which items are accepted into the work queue (arrival curve), and the rate at which they are completed (departure curve). At a given point in time, the flow load is the vertical distance between the curves at that point. This helps you identify potential bottlenecks that need to be investigated.

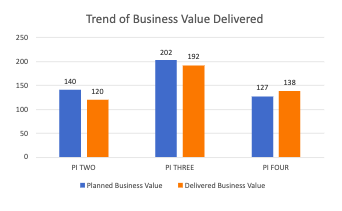
Business Value Delivered
- This report can show the trend of what was the planned value vs delivered in every cadence.
- The cadence can be of a sprint, Program increment or even quarterly based on the need
System Level & Quality Metrics
Code Coverage
- Code coverage is a percentage which signifies the amount of lines of code tested
- There are several tools available in the market to enable code coverage metric
- Development teams write unit tests to test the code they write. This ensures partial quality at the source code level if not
Failed Deployments
Again an essential metric keeping in mind the continuity of delivery,
- Failed deployment is a metric which signifies how many times did the delivery pipeline fail to deploy, configure or push changes to the designated system or branch.
- It is calculated over a period of time or even in cadence
- The number of rate / percentage signifies the maturity of the deployment pipeline system
- High performing teams have less number / rate of failed deployments
Blocked Time
- This metrics is used to identify the age of the tickets which are in blocked state
- Work items can be in blocked state either due to dependency, lack of clarity, lack of ownership etc
- This is a very important metric which helps in surfacing the underlying problems in the team in smoothening the process and people bottlenecks
Defect Removal Efficiency
Defect Removal Efficiency (DRE) is a quality metric that shows the maturity of a testing process in identifying and eliminating defects /bugs from the system during its development.
A higher DRE value indicates an effective testing process, as it shows more bugs were caught and fixed before the production migration
If X signifies the number of bugs that were identified before the production, and Y is the number of bugs that were leaked to production, then
DRE = (Y / (X+Y))*100
Innovation Metrics
These metrics help a company / teams to look at their ability to bring in innovations to their future business with customers. Innovation is a part of agile environment where the solutions and scope change based on the new technology / systems which emerge in the market. Some of the innovation metrics include
- Usage Index – This is the rate of features which are not used by the customers / consumers. Constantly monitoring this metrics also helps teams to innovate new solutions for new problem statements
- Innovation rate – A simple percentage of how much budget or money is spent on innovation activities like hackathon , RnDs, etc. This metric helps management to understand if they need to push in more budget for innovations which will in turn help the teams build features which the customers are looking for.
Business Metrics
As mentioned above, there are certain agile transformation success metrics which can be implemented at business levels as well. While there are metrics for effective agile transformation at team level, release level, program level, there are agile transformation metrics for executive level folks to monitor, pivot and take business decisions to take the business ahead. Some of them include:
- Purpose and Vision – Purpose and Vision are the overarching statement / direction for any product development. While the success or progress towards these can be measured using,
- OKRs
- Spike in Revenue
- Reduction in Operation cost
- Churn rate
- Customer retention
- Net promoter Score
- Customer Satisfaction
- Employee Engagement – One of the agile transformation success metrics is measuring how employees are involved in decision making, collaboration and their willingness to refer their friends. This can be measured with a lot of metrics like
- Conducting Agility health assessments
- Niko Niko calendars
- Employee Satisfaction Score
- Continuous Improvement – For an Effective agile transformation, one of the main aspects to inspect is the ability of the teams to continuously improve. Below are a few metrics which are used to measure continuous improvement. These metrics are explained in detail in the above sections
- Lead time and Cycle time
- Defect Removal Efficiency
- Failed Deployments
- Agility health assessments
- Productivity – Productivity insights are a key to understanding the process gaps within the team. These insights surface a wide variety underlying problems which can further be reduced by certain action items. Those include,
- Velocity Chart
- Lead time and Cycle time
- Control chart
- Cumulative flow diagram
- Epic and release burndown chart
- Team burndown chart
Again all of these metrics are explained in detail in the above sections.
- Predictability – Predictability being one of the important aspects of agile teams, can be measured at various levels like,
- Program predictability measure (PPM) at a program level
- Epic & release burndown chart at a release level
- Velocity chart at a team level
- Lead time at a release & team level
- Burndown chart to predict the sprint success
- Quality & Speed – Agile ways of working promotes faster delivery. This is done by delivering smaller chunks of high value work prioritized , developed and released frequently with quality
- Two direct metrics which can help teams and businesses to understand the speed of delivery are Lead and Cycle time.
- Code coverage, Failed Deployments, Escaped Defects, Defect removal efficiency are some quality metrics that can used to inspect the quality which are explained in detail in the above sections
How To Track The Right Agile Metrics?
Agile metrics are not a target rather are insights which can be analyzed to help teams and organizations improve continuously. Before we understand what are the effective metrics for agile transformation that are to be captured, it is important to understand:
- The purpose of the metrics
- The project need
- Team’s current maturity & composition
- The framework the teams wants to use
While there are a wide range of agile transformation success metrics which teams can use, not all of them can be the right fit for them or their project. So choosing the right set of metrics to measure agile transformation becomes crucial so that teams can benefit from it. Here are a few steps that can help you track the right metrics for your teams
- Identify the right set of metrics which will help the team inspect and adapt. While choosing the metrics cover all product, people and process aspects
- Educate the team on what the metrics mean and clearly set the expectations on how they can benefit them
- Train the team on how and why the metrics to measure agile transformation will be used, how to read them
- Ensure metrics provide insights and action items at all the levels of the team from developers till the management
- Do not set any target for a metric. For example a team should not target to complete 40 Sps every sprint. Remember metrics are insights
- Choose metrics based on the framework you are using, eg: Scrum uses a set of metrics which can help improve team’s practices and performance while kanban might not recommend those metrics
Benefits of Agile Metrics in Project Management
Most organizations are moving towards agile ways of working. It helps in reducing the time to deliver value to customers. Helps teams respond to changing needs, reduces feedback loop for the teams. Increases customer satisfaction.
However, for the teams to reap benefits, they have to inspect the way they are working, planning and delivering so that they can pivot wherever needed. There are several ways in which agile metrics helps the teams and organizations and serve as agile transformation KPIs, some of which are:
- It promotes continuous improvement within the team and the product
- Helps in identifying gaps with people, process and product
- Enables teams to be more transparent, predictable and efficient
- Surface up underlying issues so that they can be resolved at the earliest
- Helps teams identify patterns which could be a potential threat or risk
- Increases customer satisfaction with transparent data
Recommended Read
Conclusion
Implementing the right set of Agile transformation metrics that fit into an organization’s needs and goals is vital for a successful Agile transformation journey. These metrics guide teams in optimizing their processes, improving productivity, and delivering value consistently , ultimately driving the success of Agile initiatives within the organization.
Again, always remember that the idea is not to run behind the metrics, rather the insights from the metrics should help the team improve continuously and move in the right direction.
With this, our blog on “Key Agile Transformation Metrics for measuring Business Success” comes to an end. Please reach out to us at “consult@benzne.com” for any support you may need in your agile transformation journey.
