


Tracking the progress through typical charts & metrics have often been boring & one of the kind is burn-down chart & hence decided to create my own innovation called the Beer down chart.

Imagine, you are in a agile team and have a barrel of beer to finish. Every time you finish your beer, you go to counter and ask for one more.
The beer is served in Pint, Pitcher, big bottles in all shapes which resembles the size of the user stories which could vary. Drink one story at a time & always the top priority first..
The goal is not who drank how much but as a group or team how much you could finish by the end of the sprint. Applause if you could finish what you have planned or more than that by the end of the sprint..
We believe this group (scrum team) to be drunkards (self-organising and motivated) enough to ask for more beers as we do not push anyone to drink..
Now let us understand by an example:

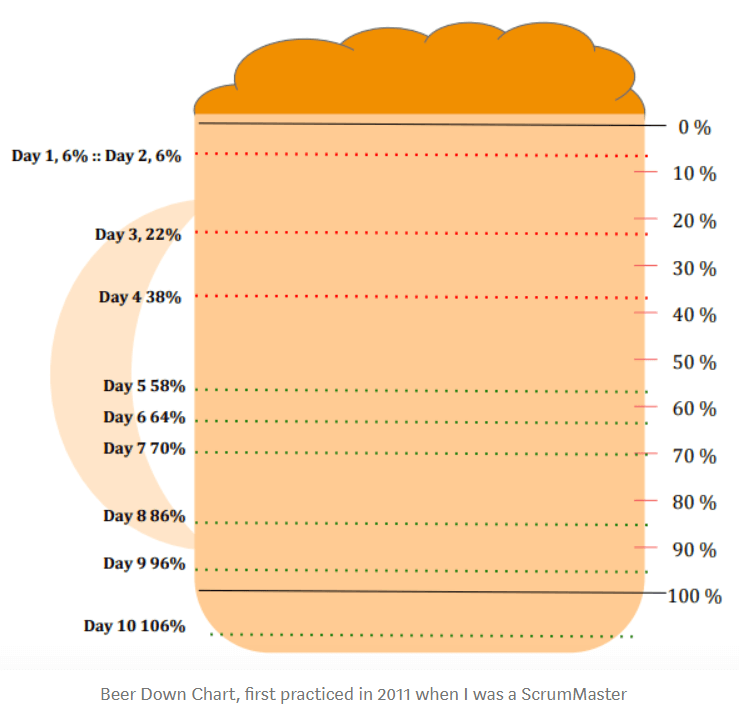
Look at the beer down chart image.. Right side, we have expected percentage indicators (10%, 20% .. 100%) and on the left side are actual burn-down cumulatively captured each day (6%, 6%, 22% .. 106%)

Above table shows the daily burn-down in story points and also in % .. If the actual is less than expected then it is shown by red line.. otherwise it is green line..
Take time to relate the values in table with the beer down chart image..
Here a scrum team has planned to finish 50 story points of work. All the stories are placed in a beer barrel at the start of the sprint by Product Owner (being bartender)..
So, this is how it works.. You (as a development team member) get your beer from the barrel (backlog) and start drinking.. once finished then get it reviewed by Product Owner.. PO reviews if the work is really finished.. If it does, then the beer mark goes down & you can take another beer.. And this routine follows
The next order you may get a can or a pint or pitcher which signifies the varied sizes of the user stories.. Just follow the order of priority and start drinking it..
For you and all the team members – the beer level goes down only when a story gets finished..
So, everyday team observes how much beer left before the sprint ends?
Since, sprint is time-boxed, hence the unfinished work goes back to the backlog and will come in next iteration.. Same like any bottle not opened could be used in another party
Velocity of the team could be related with the team’s drinking capacity..
Not in every team this will be appreciated but you can form your Ice Tea down chart or Cold coffee down chart or whatever you want to call it..
All you need is to have fun while you work! 🙂
