Introduction
Gantt Charts and Agile have traditionally been viewed as mutually exclusive. Gantt Charts represent a traditional, predictive methodology that emphasizes planning, control and linear progression. Gantt Chart relies on a detailed project schedule, precise task dependencies, and fixed deadlines. In contrast, Agile is an adaptive, iterative framework that prioritizes flexibility, collaboration and continuous improvement.
The differences between Gantt Charts and Agile are stark. Gantt Charts require detailed upfront planning, while Agile encourages iterative development and flexible requirements. Additionally, Gantt Charts measure progress through percentage completion of the entire work, whereas Agile ways of working is about delivering value to end users by continuously experimenting, failing faster, encouraging feedback and delivering incrementally.
These opposing philosophies often lead to conflicting views on project management. Proponents of Gantt Charts value structure, predictability, and control, whereas Agile advocates prioritize adaptability, collaboration, and responsiveness. Gantt Charts are often seen as rigid and inflexible, while Agile is viewed as lacking structure and discipline as it is applied in cases with vulnerabilities, uncertainties, complexities and ambiguity . However, this dichotomy overlooks the potential synergy between the two.
Despite their differences, Agile methodology and Gantt Chart are not inherently antithetical. By recognizing their strengths and weaknesses, teams can integrate elements of both to create a hybrid approach that suits their specific needs. This blended methodology can leverage the predictive power of Gantt Charts for high-level planning while embracing Agile’s iterative nature for tactical execution.
Ultimately, the choice between Gantt Charts and Agile Methodology should not be an either-or proposition. Instead, teams should focus on finding a balance that harnesses the benefits of both to deliver successful project outcomes.
What is an Agile Gantt Chart?
As mentioned in the above heading, we need to explore the hybrid approach that could give the power of predictability & control as offered by Gantt Chart and at the same time the flexibility, element of experimentation and continuous improvement traits which are characteristic of agile approaches.
Here is an attempt to introduce an integrated framework that enables teams to leverage the benefits of both worlds, for that the hybrid approach has to blend two key elements –
- High-Level Planning (Gantt Charts) defines project scope, timeline, and milestones, identifying critical dependencies and major deliverables.
- Iterative Execution (Agile) breaks down major deliverables into smaller, iterative tasks, using Agile sprints, Kanban boards, or Scrumban for task management.
In brief, the mantra is:
For long-term planning, we should use Gantt charts.
For day-to-day execution, we should use Agile approaches.
To maximize usage, the Gantt chart could also be used to showcase the iterative outcomes and incremental fulfillment of objectives.
Almost all the tools provide timelines features which is nothing but a Gantt chart. Also, we should use Agile metrics to calibrate Gantt Chart adjustments. Let’s explore by understanding certain use cases. The Agile-Gantt hybrid approach is suitable for:
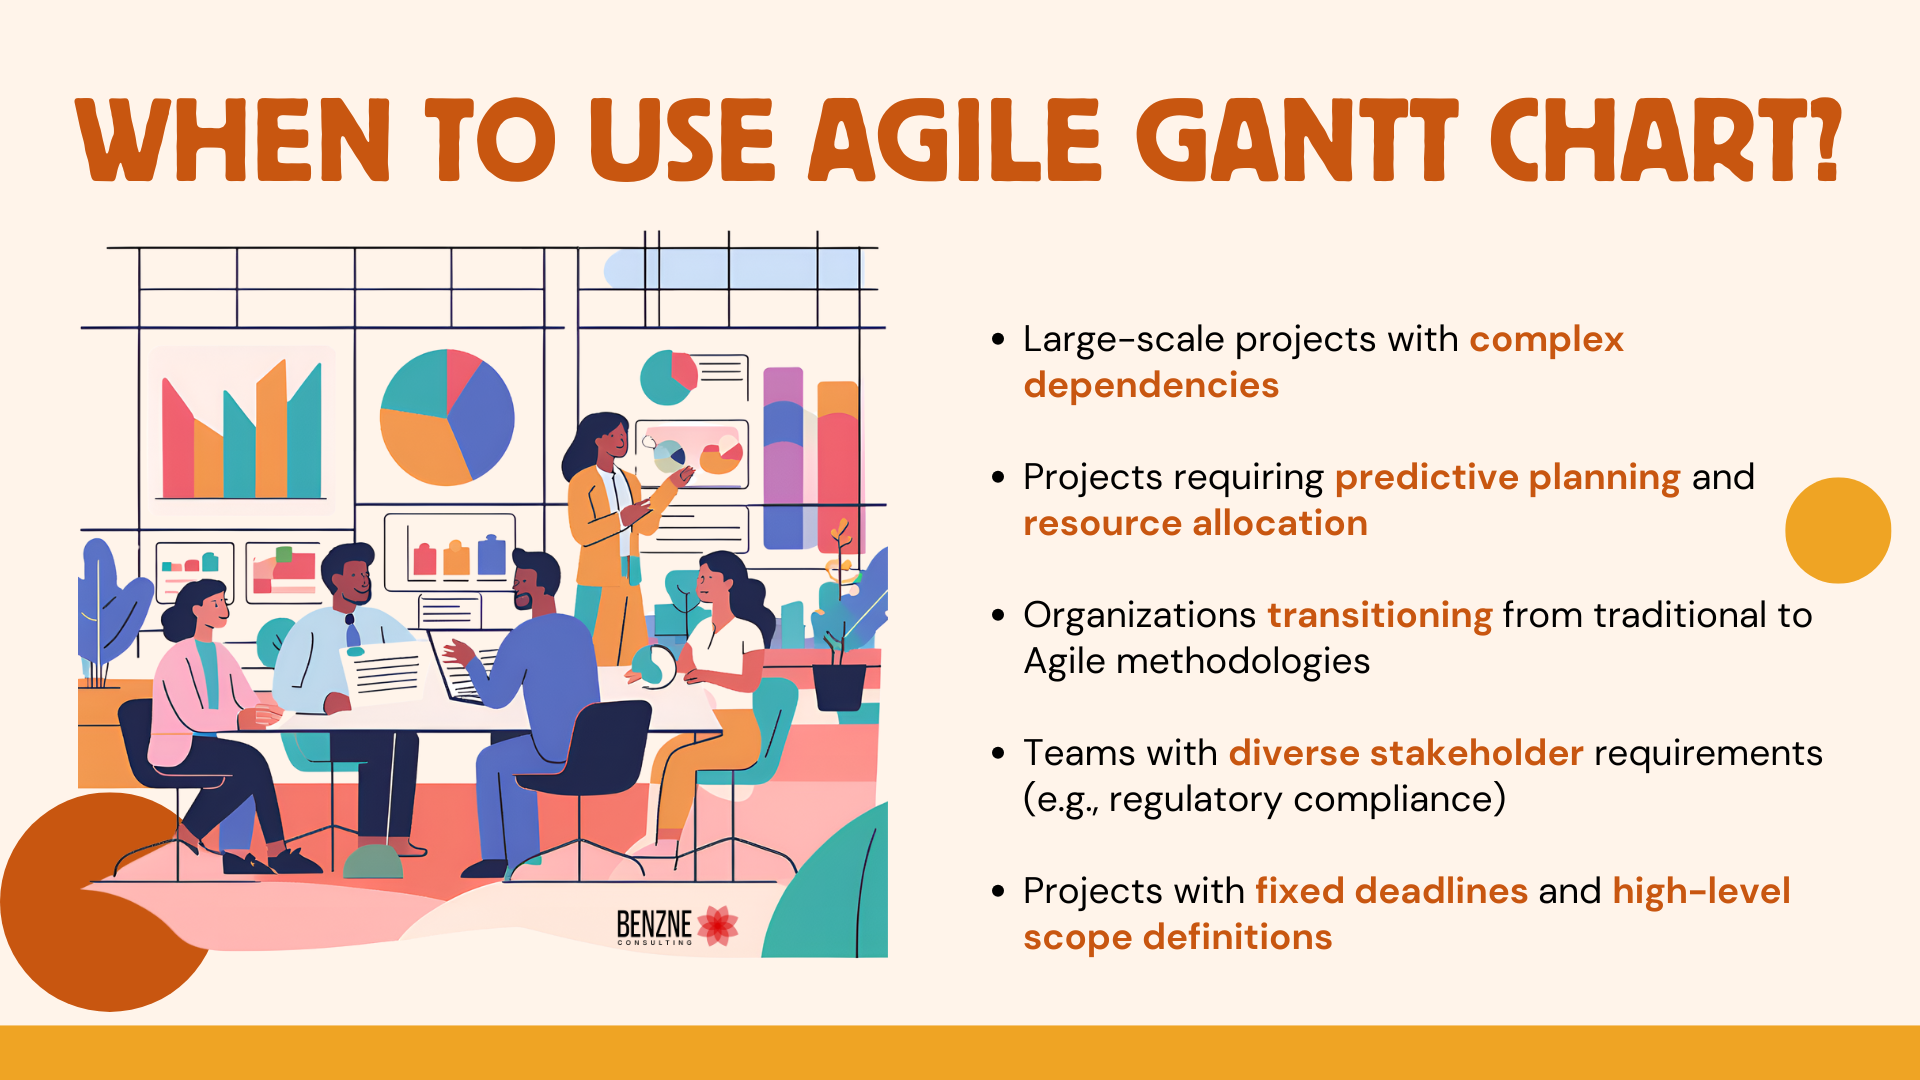
- Large-scale projects with complex dependencies
- Projects requiring predictive planning and resource allocation
- Organizations transitioning from traditional to Agile methodologies
- Teams with diverse stakeholder requirements (e.g., regulatory compliance)
- Projects with fixed deadlines and high-level scope definitions
These use cases are primarily applicable to industries like Construction, Manufacturing, Banking & Finance, Healthcare, Insurance and more of such core segments and in certain scenarios even in the IT industry.
Even in industries that are experiencing a VUCA environment like IT, the trends like OKRs (Objectives and key results) requires setting up of objectives which are reviewed weekly and quarterly, Gantt chart could be used for visualizing the plan vs actual development against the objectives.
While we are exploring the possibilities of implementing the hybrid approach, we should also be aware of following anti-patterns that may create new pain:
- Over-emphasis on Gantt Charts, stifling Agile’s adaptability
- Insufficient Agile iteration, leading to waterfall-like behaviour
- Lack of communication, creating silos and confusion
- Inconsistent metrics, conflicting performance evaluations
- Over-reliance on tools, overshadowing collaboration and adaptability
To avoid these anti patterns while using Gantt chart in Agile, we should take the following few things into the account while implementing the hybrid approach of Agile Gantt Chart:
- Train teams on both Gantt Chart and Agile methodologies
- Establish clear communication channels and feedback loops
- Define metrics and KPIs balancing predictive and adaptive measures
- Regularly review and adjust the hybrid approach
- Monitor team buy-in and adjust the approach as needed
With the usage of Gantt charts in an agile environment we can pursue project management effectiveness.
How Gantt Charts Work in an Agile Environment? Can they blend together?
There are many aspects where the Gantt charts could be used along with Agile approaches. Primarily in visualising the key milestones that are intended to be achieved. Agile approach encourages us to experiment and continuously improve our solutions and Gantt charts can help us in being mindful of the milestones.
Gantt charts can also be used to plan the incremental outcomes that agile teams can attain and generate the MVP to deliver value continuously to end users.
In SAFe (Scaled Agile Framework), when we plan for a Program Interval of 3 months, then the Gantt chart is very instrumental. As an agile transformation services firm, we have used it extensively in our engagement to help us in visualizing the milestones, the work that is required to finish to achieve those milestones and also the mutual dependencies and risks that might create hindrance.
Many companies which conduct half-yearly rolling wave planning to ensure timely releases to their customers, use Gantt charts extensively to plan their work accordingly. That doesn’t mean the organization are not agile as they still ensure to respond to changes by adjusting the existing schedule, they keep shorter feedback loop to pivot their solution to meet the set objectives and improve continuously by using the Gantt chart to maintain their growth plan and checking the time taken to identify and resolve certain issues.
Above are the few critical areas where Agile methodology and Gantt charts could work well together.
How to Use a Gantt Chart for Agile Projects: Step by Step?
In agile projects, we could follow the below steps to deploy Gantt chart and leverage the associated benefits.Though these steps would work for most standard projects, consult an agile innovation consulting company to contextualize for your unique business scenario.
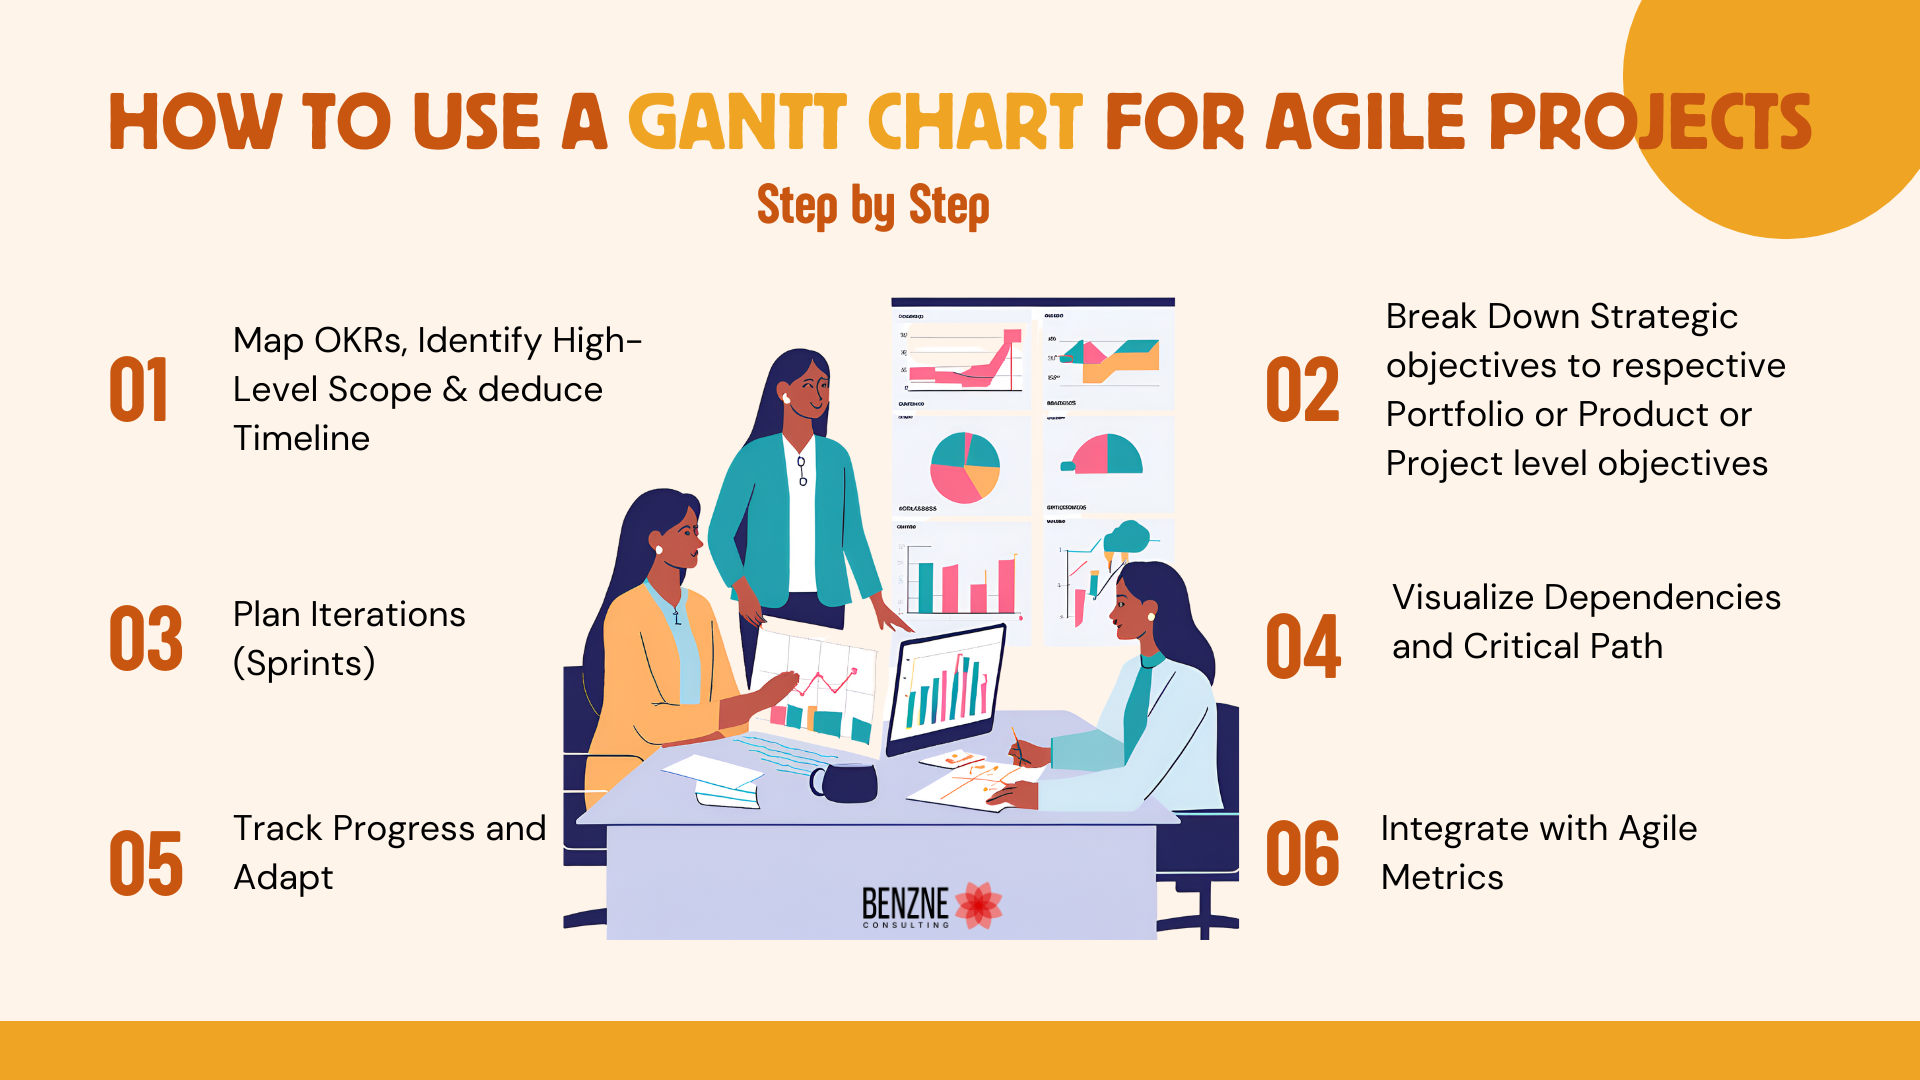
1. Map OKRs, Identify High-Level Scope and deduce Timeline

Reference: teamgantt.com
Leaders who are responsible to meet the vision and mission of the organization, need to identify, define and set objectives for the teams, this includes project or initiative scope, goals and deliverables along with the timeline and milestones. Also, tag them to the respective key stakeholders who will own it.
2. Break Down Strategic objectives to respective Portfolio or Product or Project level objectives
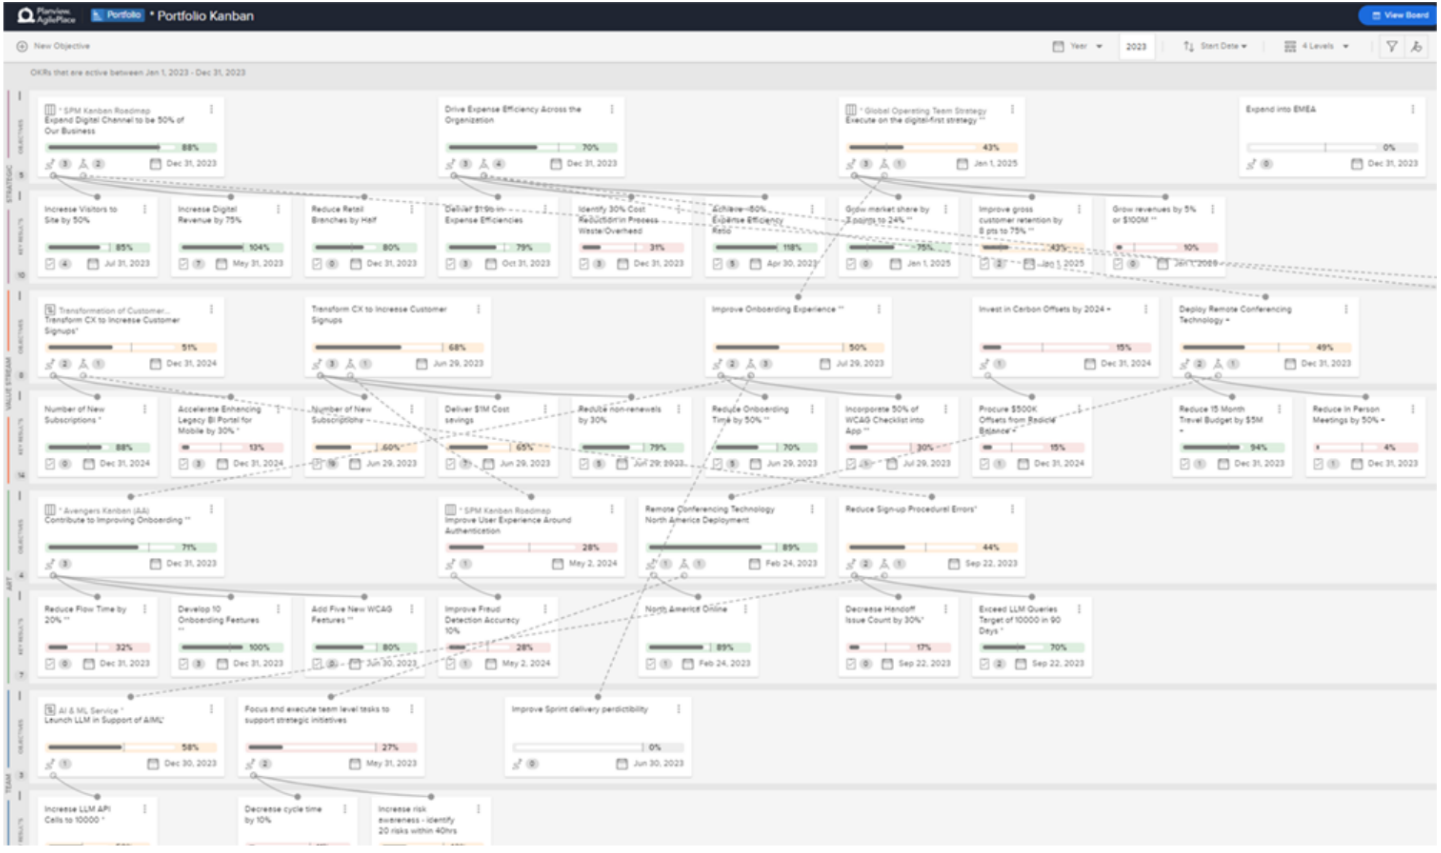
Reference: Planview.com
Identified objectives are further converted to project scope into epics or initiatives (large features).
3. Plan Iterations (Sprints)
Reference: Broadmix.com
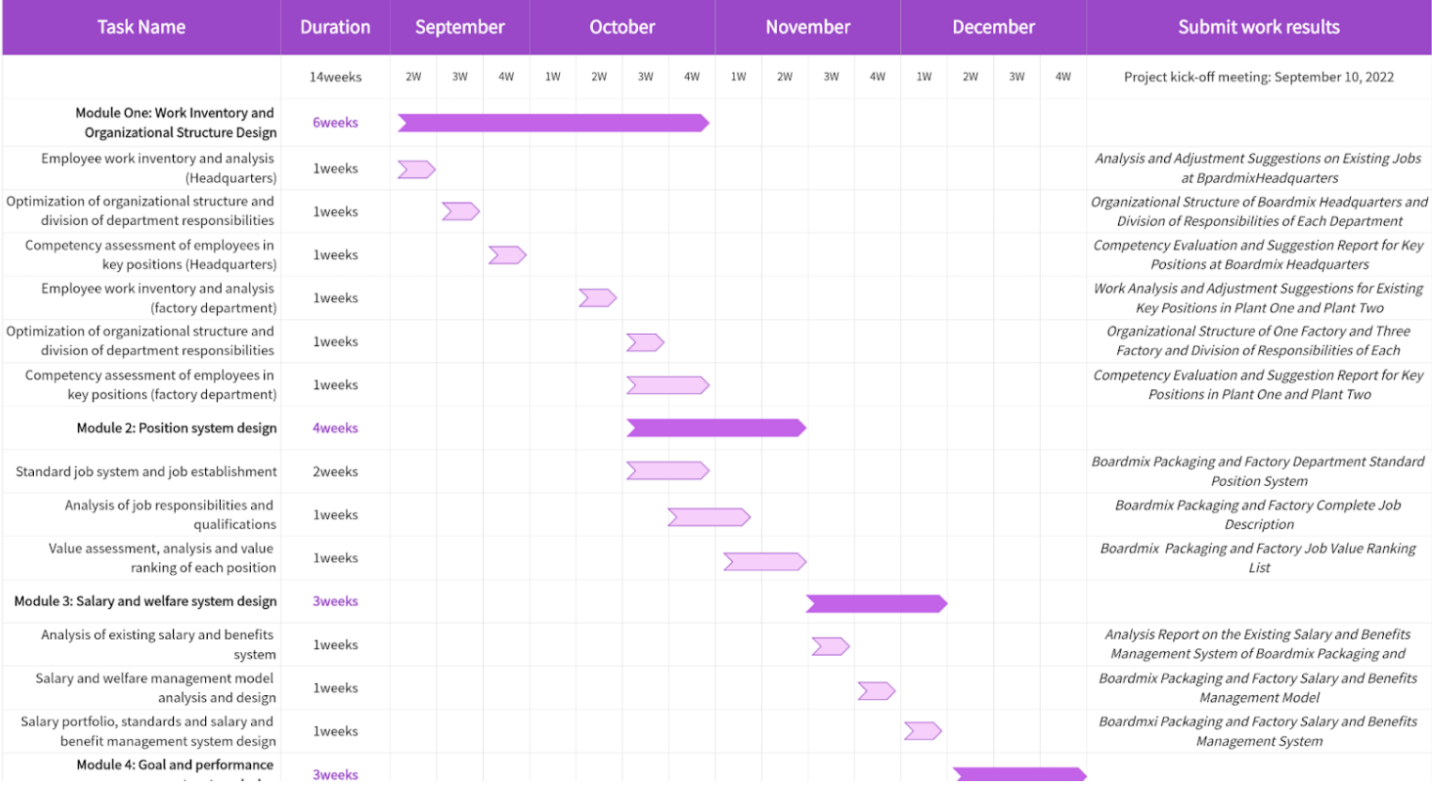
Once the objectives/goals are identified and broken to the project level then its time to divide project timeline into iterations (sprints), splitting user stories assigned to each sprint and finalizing clearly defined goals of the sprint.
4. Visualize Dependencies and Critical Path
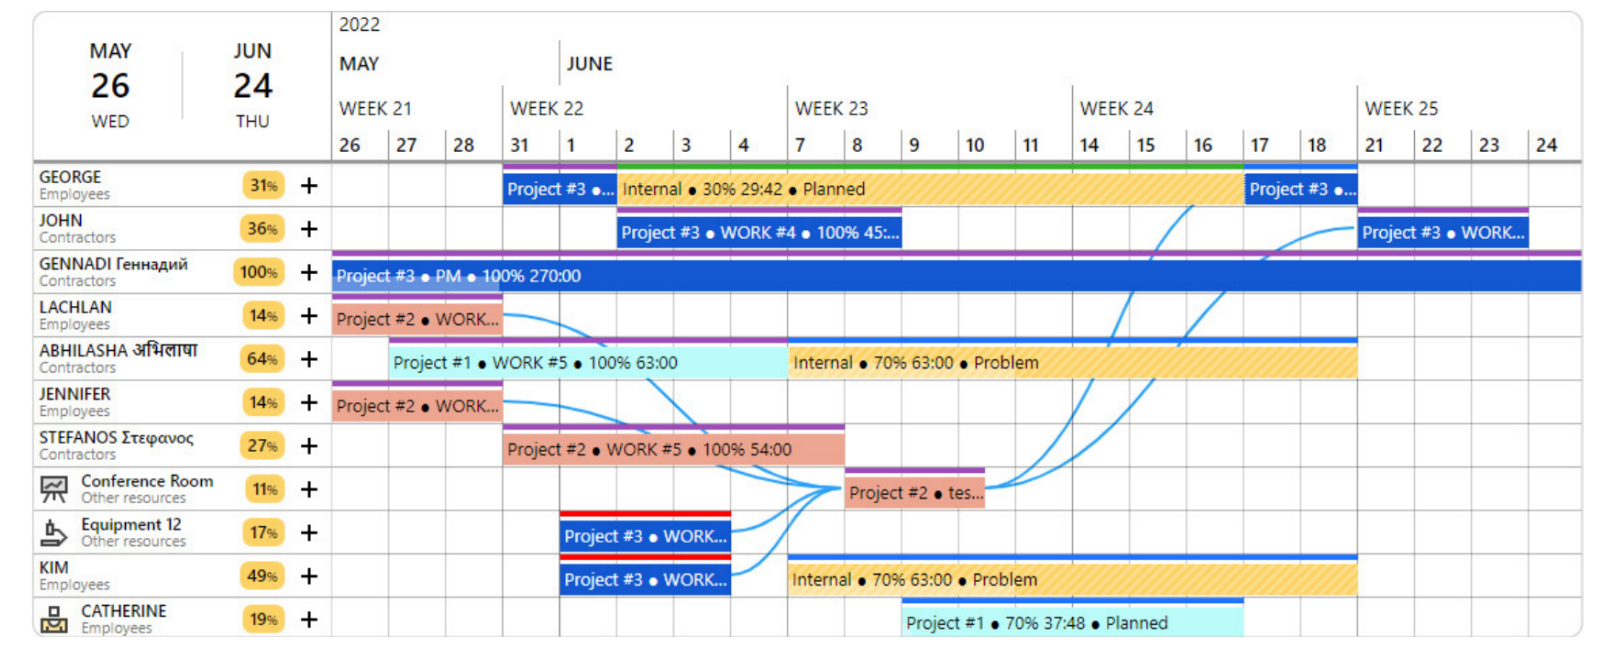
If you are working in a multi-team mode, where each team has a dependency to another team in some way then we could map it in Gantt chart.
The dependencies could be on the overall project basis or respective work items basis and with the connectors it could be visualised on Gantt chart for a birds eye view of the multi-team work environment.
The dependencies henceforth could be resolved by putting certain governance in place like having weekly catch-ups where the representatives from all the teams could participate and use it as an opportunity to flag risks and also update each other on how they are working to mitigate it and support each other to finish their respective tasks.
Reference: Ganttic.com
5. Track Progress and Adapt
Reference EazyBi.com
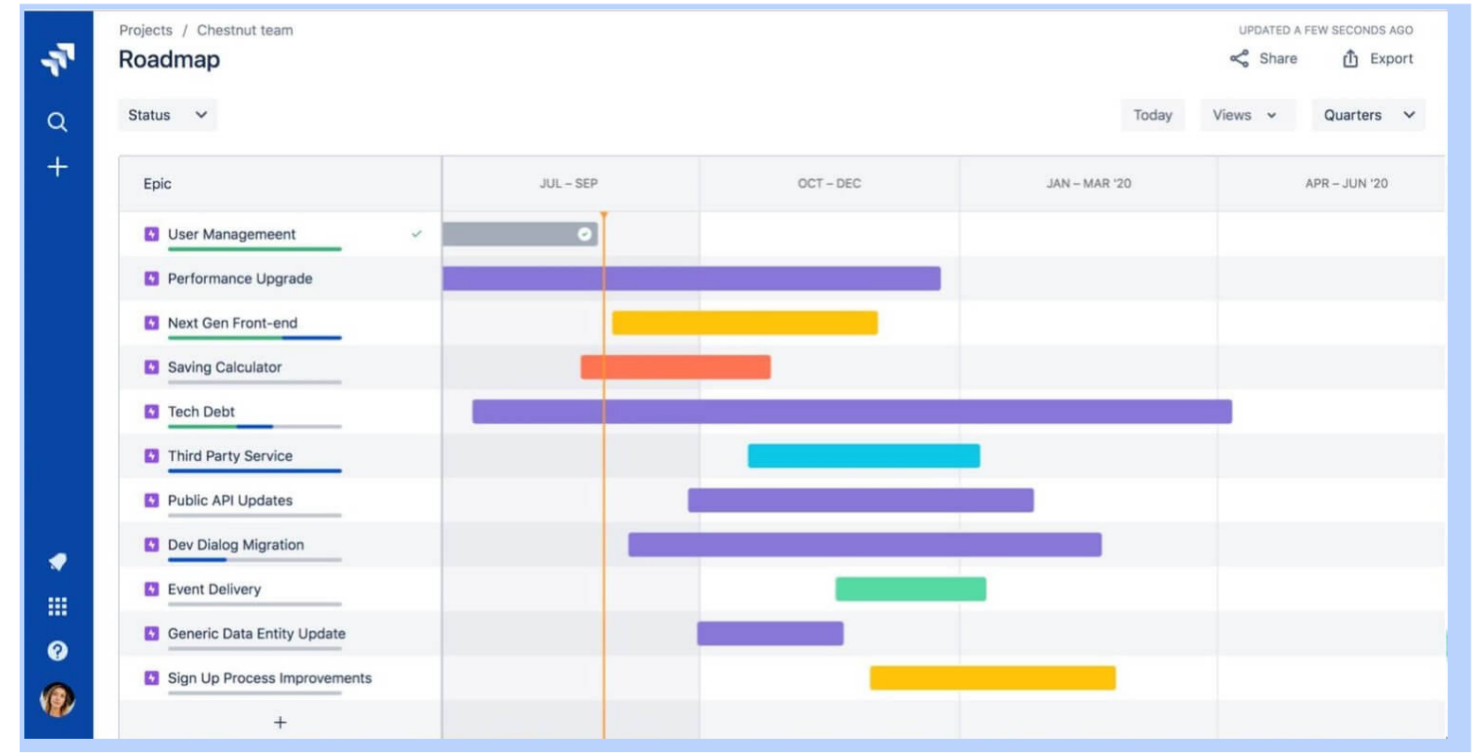
When we plan for the sprint, we need to coach our team to plan effectively for such a short duration and since the team is cross-functional they should be informing each other by when they could finish what or in other words what they want from each other, by when. The Gantt chart could be a useful tool in planning for the iterations for the team and identifying the reasons for delay by comparing with their initial forecast during the sprint planning event.
To ensure such governance, the team should ensure updating the Gantt Chart regularly to reflect completed tasks, ongoing tasks, changes in scope or timeline and also review and adjust charts during sprint retrospectives. In a way, if utilised timely then it’s like a kanban board or any other visual indicator that could guide you about the progress and any other deviations.
6. Integrate with Agile Metrics
Along with the usage of agile metrics like velocity, burn-down charts, we could refer to the Gantt Chart to make adjustments around the initial forecast that has been made on delivery plans. We should be mindful of monitoring progress timely and adjust charts accordingly for stakeholder communication.
Gantt Chart Template for Agile Projects
Lets refer to the sprint planning event where the team starts with understanding the goals of the sprint and plan for delivering them based on their capacity. Let’s say we have 5 team members (A, B, C, D, E as mentioned in the below image) and the duration is 10 days, in this case, Gantt chart could be used as a valuable tool to showcase the distribution of work in the order of priority of sprint backlog, planned by the development team to fulfil the sprint goals.
Below template could help team to understand that the estimations based on capacity is not the absolute goal, but the focus should be on delivering the goals of the sprint which adds value to the user and also help team in failing faster by seeking feedback from the reviewers.

Benefits of Using Gantt Charts with Agile Methodology
Following are the benefits that Agile Gantt chart could provide in projects that are executed in agile environment:
- Project progress visualisation
- Effective long term & short term planning
- Managing dependencies
- Increased team collaboration as visualising with trigger communication
- Being flexible if the demands are changed & showcased on the Agile Gantt chart
- Visualising complexity by identifying risks, dependencies and critical unknowns
- Real-time tracking for monitoring purpose
- Managing capacity by visualizing utilization
- Scalability for large-scale projects where multi-teams or groups are involved
Challenges of Using Gantt Charts with Agile Methodology
One of the primary concerns of using Gantt charts in agile projects is the potential over-emphasis on planning, which can conflict with Agile’s adaptability. The linear structure of Gantt charts can also struggle to accommodate Agile’s iterative and incremental approach, leading to inflexibility.
Resource allocation is also a concern, as Gantt Charts may not account for Agile’s dynamic resource utilization of team members for delivering the high-value items. Apart from this, maintaining up-to-date Gantt Charts can be challenging, especially with frequent Agile iterations.
To mitigate the above challenges, providing training and support for the hybrid approach, and monitoring progress and adapting Gantt Charts accordingly are also essential.
Gantt charts in Waterfall vs. Agile
Gantt charts in waterfall is convenient and very essential as it gives confidence to the customers when they are primarily looking for fixed-price approaches. Whereas, in an agile approach it needs to be updated continuously as it needs to accommodate the continuous changes that keep on coming in the due course of the project when it’s run in agile ways of working.
Conclusion
Be it waterfall or agile, one thing that is essential for any business to run is execution certainty (in all its uncertainties 🙂) and Gantt chart helps in communicating the confidence in the approach presented by the development team to the leadership in its fulfilment of goals and vice-versa by management to the development team in communicating their strategic objectives.
As more and more organizations adapt to Agile ways of working, they should explore leveraging the good old Gantt Charts along with a flexible and adaptable framework to get the maximum value . We at Benzne agile transformation service, would be glad to support you to contextualize Gantt charts to your Agile transformation journey , please feel free to schedule a discovery call with our team of consultants to explore how we can help.
With this our blog on “What is an Agile Gantt Chart and how to use” comes to an end and we hope this has helped you understand the concept, applicability and and help in implementation with an Agile Gantt Chart step by step guide. Please write to consult@benzne.com for any feedback or suggestions.
Frequently Asked Questions About Agile Testing Methodology
1. How do I use the Agile Gantt chart in Excel?
Follow the following approach to templatise Gantt chart in excel:
Assuming it is for a project that is run using Scrum framework,
- Set up columns: Task, Start Date, End Date, Duration, Resources.
- Create a bar chart: Insert > Bar chart > Select data range.
- Customize: Add dependencies, milestones, and sprint markers.
- Update regularly: Reflect changes in task status and timeline.
2. What is an agile model in management?
The management team focuses on key drivers like customer retention, onboarding new clients, launching new products, reducing operational costs and such aspects. To attain that, they set OKRs or goals which are linked to respective initiatives which could be attained using agile ways of working by continuous experimentation promoted by agile ways of working.
3. What is an agile transformation consultant?
Agile transformation consultant is the one responsible for inculcating the agile mindset and propagating culture that could help organizations in building the fabric of being responsive to change instead of reacting and over the course cultivating the trait of proactive attitude to learn how they could grow further. The consultant is skilled with observing the as-is condition and identifying opportunities of improvement and partners with the internal core-team to make shifts that could lead us towards the desired path.
