


Any product or service delivered to a customer has to go through a series of steps or a process flow. Organizations do define a process or flow through which the customer needs are satisfied.
A value stream is the set of actions that take place to add value to a customer from the initial request through realization of value by the customer. The value stream begins with the initial concept, moves through various stages of development and on through delivery and support. A value stream always begins and ends with a customer.
Value Streams highlight the flow of value, delays, rework, and bottlenecks. They illustrate how the current flow affects the people who do all the work.
- All the steps necessary to convert the trigger to the delivery of value
- The people who perform these steps
- The systems they use to do their work
- The flow of information and materials that are necessary to satisfy that request
Now that we understand what a value stream is, the million dollar question which arises is “What is Value Stream Mapping?” – As the organizations continue delivering value, there is always a question of delivering the value faster and keeping the stream as lean as possible. And that process of identifying the gaps and delays in the process is called Value Stream Mapping.
What is Value Stream Mapping?
Value Stream Mapping (VSM) is a lean management technique used to visualize and analyze the flow of materials, information, and activities required to deliver a product or service to customers. It provides a comprehensive view of the entire value stream, from the moment a customer places an order to the final delivery.
Value stream mapping is done for analyzing the current state and designing a future state for the process that takes a product or service from its inception to the customer.
VSM, was primarily used in the manufacturing line initially to understand the flow of materials, work streams, logistics etc and reduce the gaps. However, it gained popularity in the corporate set up which included flow of information, handoffs, sign offs and many more. Value Stream mapping can be done in any set up which includes product delivery and service delivery.
Why do we use Value Stream Mapping?
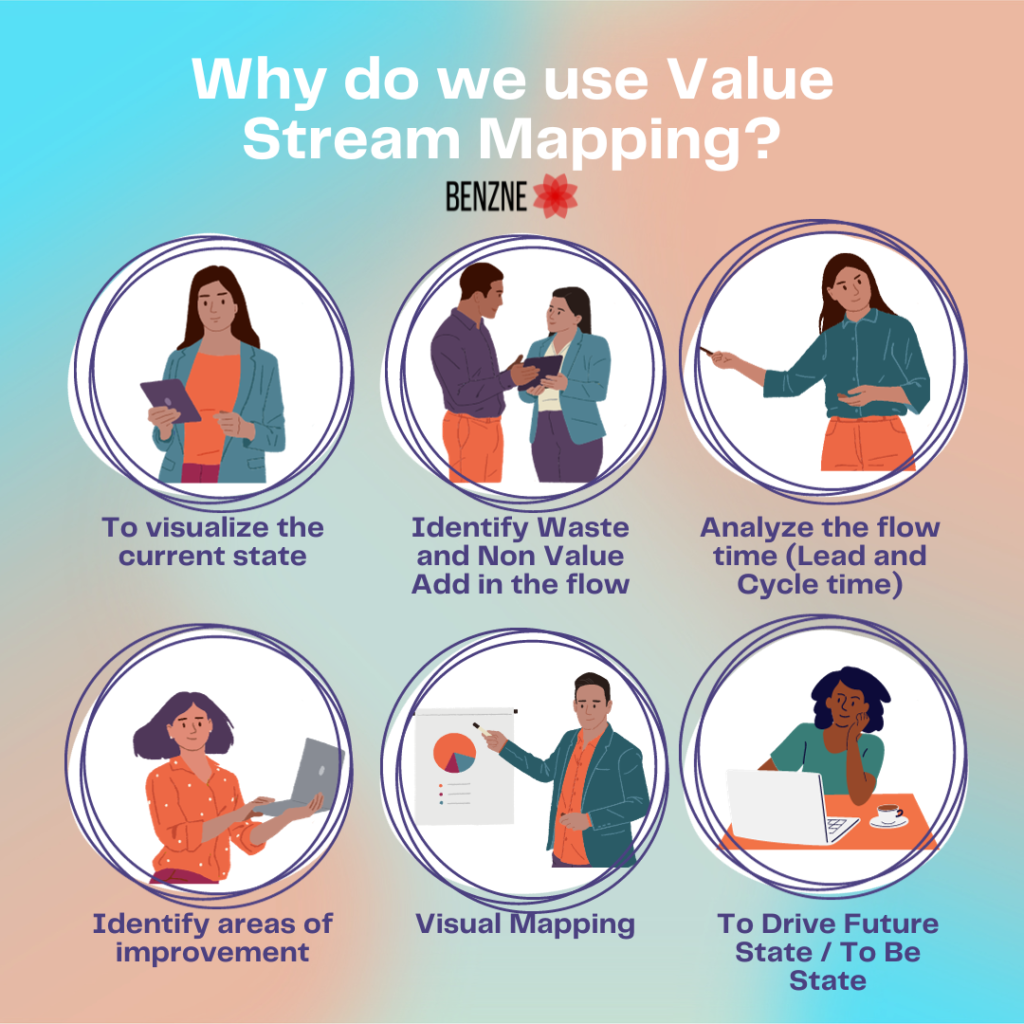
Value stream mapping is used to enable organizations to better understand their processes, eliminate waste, improve flow, and ultimately provide greater value to customers. Some of the reasons why we use VSM are:
- To visualize the current state – To map out all the steps, people, information flow, material flow involved in delivering value to the customer
- Identify Waste and Non Value Add in the flow – Once the stream is plotted, VSM helps in reviewing it, to understand which steps are actually not adding value and further causing bottlenecks in the process.
- Analyze the flow time (Lead and Cycle time) – Time taken for one complete transaction of value delivery, or time taken in each step of the stream can be plotted with VSM thus helping the organizations reduce the delays
- Identify areas of improvement – If there are any repeatable steps in the process which can be automated, or if any step needs some digital intervention, VSM as an activity surfaces these areas.
- Visual Mapping – Since VSM depicts the flow and delays visually, it helps teams and units to collaborate effectively and brings in clarity with respect to a common understanding where multiple teams are involved
- To Drive Future State / To Be State – With VSM activity it becomes easy to change or tweak the process flow to cater to the goals/objectives set by the organizations.
VSM purpose and benefits
Value Stream mapping analysis helps organizations to visualize every step they take to deliver a product or service. Not only that, it is about finding where they could do better, reduce delays and hiccups or even transform into new ways.
- Understanding As Is Process – VSM helps identify all the steps involved in the current process
- Value Driven Program – With VSM, companies can identify the steps which are actually adding value and steps which are adding to the overhead
- Eliminate Waste / Delays / Hiccups – There could be delays or overheads in some of the steps and VSM helps in identifying them to reduce them
- Harmony in understanding – VSM visualizes the process involving multiple teams and also surfaces the concerns which promotes transparency, this enables everyone in the company to align to the common goals of transformation
- Relentless Improvements – VSM is not a one time activity, rather it is done often to keep the process evolving to cater the change in customer needs and new technologies
Value Stream Mapping Examples
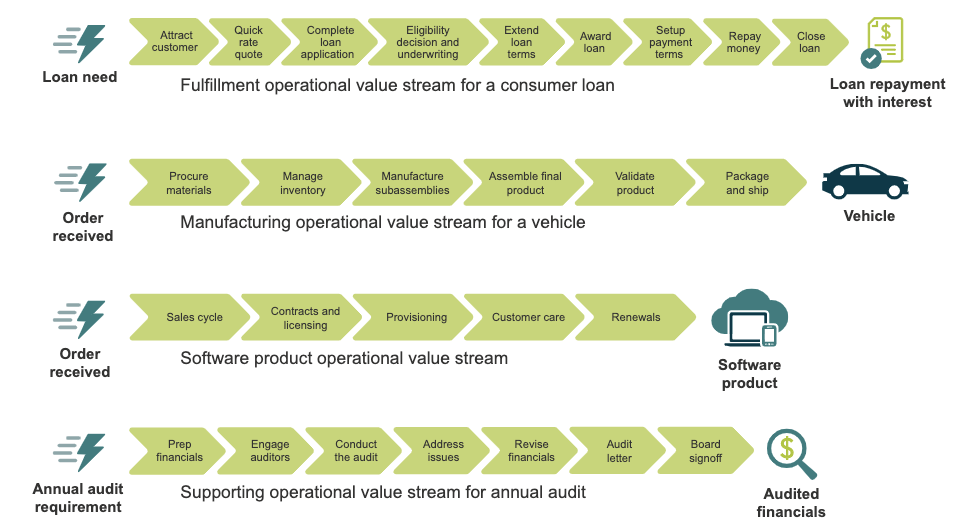
At a high level, there are 4 patterns of Value streams,
- Fulfillment Value Stream – Usually tied along with products catering to a customer’s order. Example includes ecommerce sales
- Manufacturing Value Stream – Steps and flow which converts materials into a product which customers can use. Example car manufacturing line
- Software Products Value Stream – Steps involved in delivery of a product and services. Example include SaaS, IT services etc
- Support Value Stream – Flow of steps for internal support purposes. Examples include recruiting, auditing etc
When it comes to the exercise of VSM, there are flowchart tools which can be used. These tools come with in-built symbols and connectors which can speed up the process. But also, white boards can also be used to draw out the process flow.
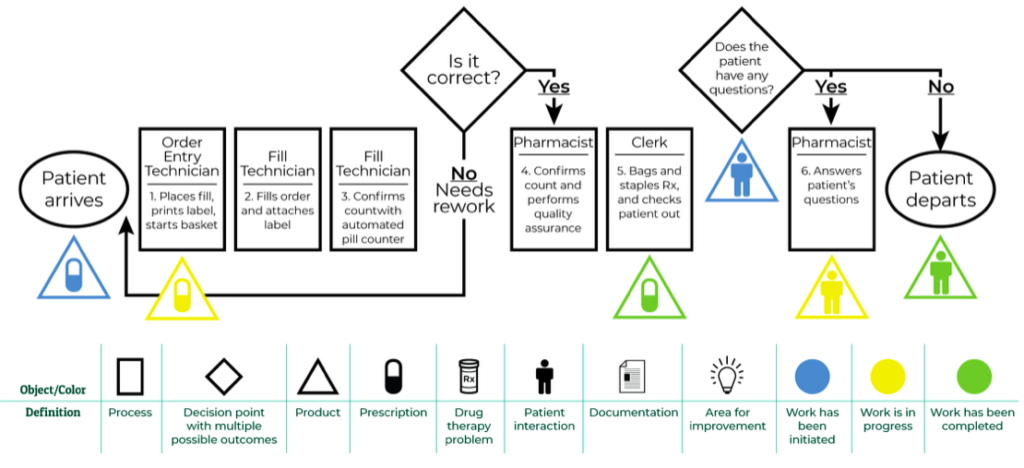
The picture below shows the Value Stream Mapping in health care. This depicts the flow of a patient getting his prescription refilled from the hospital.
How VSM is used in different fields
Value Stream Mapping was initially used mostly in the manufacturing lines, however, due to its efficient way of visualizing the process and helping companies reduce delays and waste, other fields have also found it relevant and its popularity grew over time.
- Manufacturing – Value stream mapping program was initially developed or used mostly in this field. Starting from inventory of raw materials, till the end product is delivered, companies get to draw out the entire process. This helps in identifying the excess inventory, waiting times, manual intervention and helps in improvising.
- Healthcare – VSM in healthcare is used primarily in making the patient care process as lean as possible.This field use VSM to reduce wait time,smoothen the patient’s experience and make it as easy as possible starting from getting admitted till the discharge.
- Service Industry – VSM has been successfully implemented and used in service industries like banking, insurance. Value stream mapping programs help them optimize their service delivery process. Example, VSM can help optimize a bank’s loan approval process.
- Software and IT – VSM in software can be used to improve the flow of work. It helps identify the bottlenecks, lead time & cycle time, repeated manual steps, waste in the flow and helps teams deliver value to the customer fast.
- Government and Public Services – Governments use VSM to optimize their public related services. It helps them to draw out the process , understand the hiccups and smoothen the flow. Example, VSM can be used to speed up license renewing process.
The challenges of value stream mapping
While Value Stream mapping analysis is really helpful for the organizations, there are a few challenges or anti-patterns which come along when you are thinking of doing one. Some of them are,
- The first step in VSM is to identify the scope of it. Lack of clarity on the same would diverge the process flow and people may spend a lot of time mapping processes which may not be even relevant for the transformation. So lack of clarity could end up becoming a challenge
- VSM definitely involves teams from different expertise / functions. Unavailability of people from different teams will result in not gathering sufficient specific data which will in turn result in not understanding the value stream completely
- VSM mostly is done with the help of a tool, where multiple team members collaborate. If the team members are not trained on the specifics of the tool, there will be a lot of to and fro communication and the whole process of VSM becomes overwhelming
- Findings of VSM are usually new initiatives and change in process. Resistance to change from employees will not help the VSM activity. Set a clear expectation as to what is the purpose of doing the VSM
- VSM bottlenecks and delays are decided based on hysterical data available for the current flow. So collection of data could be a challenge and inadequate data could result in wrong understanding and thus will not help improve. Ensure you have enough data and patterns which can help you make decisions.
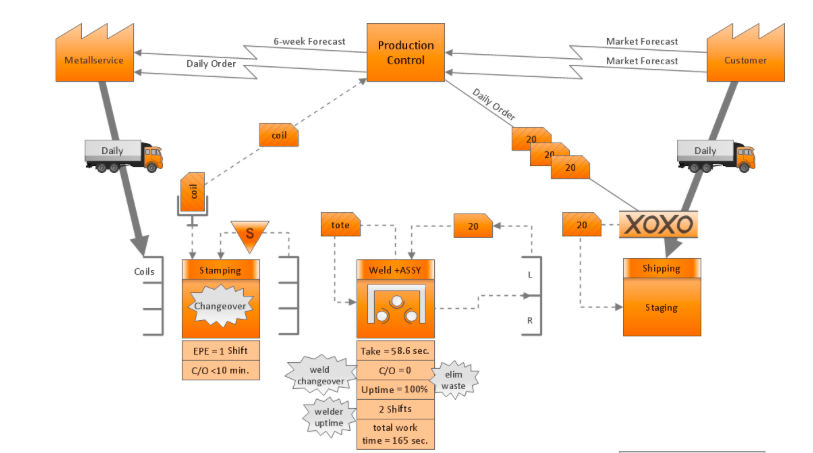
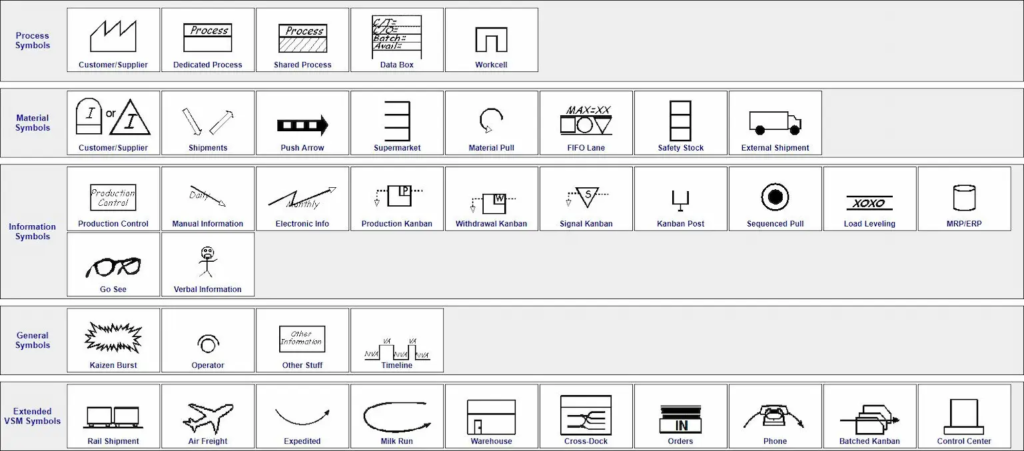
The Main value stream mapping symbols
It is important to understand and know the symbols used in Value Stream mapping exercises to avoid confusion. There are a lot of tools which are available to do the exercise and a lot of symbols used. But here are a few mostly used symbols.
- Supplier/Customer – Depicted as a triangle pointing left / right. The Supplier symbol tells the source of material and customer symbol signifies the end of value
- Process Box – A rectangle box which signifies a specific flow or step in the flow which includes lead time and other metrics
- Data Box – A rectangle box which is associated with a process box usually which contains the quantitative metrics of the process
- Workcell – Represented by a U-shaped symbol, a workcell indicates a group of processes or workstations closely located to improve efficiency and collaboration.
- Push Arrow – A straight arrow indicates the flow of materials or information from one process to the next. A push arrow signifies a “push” system where production is driven by a predetermined schedule rather than customer demand.
- Kanban Symbol – Represented by a small rectangle, the kanban symbol indicates a visual signal used in pull systems to authorize the production or movement of materials based on demand.
- Electronic information Flow – Depicted by a lightning bolt or squiggly line, this symbol represents the electronic flow of information, such as orders, invoices, or data, between processes.
- Manual Information Flow – Represented by a dashed arrow, this symbol signifies the manual or physical flow of information between processes.
- Timeline Symbol – A horizontal line with time intervals marked on it helps show the timeline or sequence of events in a process.
How value stream mapping identifies and reduces waste
Any step or activity which does not add value to the stream is a waste. And eliminating the waste is the sole purpose of VSM. Waste in VSM is identified and categorized using “7 Waste framework”
Overproduction:
Producing more than what is needed or producing ahead of demand leads to excess inventory, storage costs, and increased chances of defects. Overproduction is considered a significant waste because it ties up resources without providing immediate value to the customer.
Inventory:
Excess inventory ties up valuable resources, including space, capital, and labor. It can result in additional costs for storage, increased lead times, and the risk of obsolescence. Inventory, beyond what is immediately required, is considered wasteful in VSM.
Motion:
Motion waste refers to the unnecessary movement of people or equipment within a process. Excessive motion can lead to increased fatigue, errors, and inefficiencies. Optimizing the layout and design of workspaces helps reduce motion waste.
Defects:
The presence of defects in products or services results in rework, scrap, and additional costs. Defects can damage a company’s reputation and erode customer trust. Identifying and eliminating defects is crucial for achieving high-quality outputs.
Over-Processing:
Overprocessing involves adding more value to a product or service than what the customer actually requires. This includes using higher-grade materials, overengineering, or providing features that customers do not value. Overprocessing leads to unnecessary costs and resource utilization.
Waiting:
Waiting time occurs when work items or information are idle, waiting for the next step in the process. This includes downtime for machines, delays in processing, or waiting for approvals. Waiting time leads to increased lead times and reduced overall process efficiency.
Transport:
Unnecessary movement or transportation of materials or products between processes can introduce the risk of damage, loss, or additional costs. Minimizing transportation waste involves optimizing the flow of materials within the value stream.
Partially Completed Work:
Partially completed work, often referred to as work in progress (WIP) or unfinished goods, represents a form of waste in Value Stream Mapping (VSM). This type of waste can have several negative impacts on a value stream, affecting efficiency, lead times, and overall process effectiveness.
Extra Features:
This waste refers to the inclusion of features or characteristics in a product or service that are not necessary or valued by the customer. This type of waste contributes to unnecessary complexity, increased production costs, and potentially longer lead times.
Relearning:
These are the redundant activities associated with people needing to relearn information, skills, or procedures that should already be well-established. This waste can result from various factors, such as poor documentation, lack of standardized training, or inconsistent practices within an organization
Handoffs:
Refers to the delays, errors, and inefficiencies that can occur when work is transferred or handed off from one person, team, or department to another within a process.
Delays:
Unnecessary waiting or idle time within a process that does not add value to the product or service from the customer’s perspective.
Task Switching:
Refers to the inefficiencies and productivity losses that occur when individuals or teams frequently switch between different tasks or activities within a process. Task switching, also known as multitasking, can lead to increased lead times, and reduced focus.
How to bring value stream mapping to your team?
- Step 1 – Understand the principles of VSM, get familiar with the tool and the symbols
- Step 2 – Narrow down the process you want to target and define the scope of VSM clearly
- Step 3 – Identify the people needed from all functions and units to do the VSM and set expectation as to what is needed from them and when
- Step 4 – Explain the “Why”, “How” and “What” part of the VSM activity
- Step 5 – Schedule the session and send the invite and ensure all logistics are taken care of
- Step 6 – For the stream identified, define the process steps. Note that the process steps have to be in detail and not just superficial
- Step 7 – For each process step, collect the process data. Collect quantitative metrics which will help evaluate the effectiveness of the step
- Step 8 – Perform the Value stream mapping analysis. That is, for each step analyze the data available
- Step 9 – Mark the improvements needed. Draft a “To Be” flow with necessary target metrics
- Step 10 – Create an action plan with action items and the owners associated with the timeline
- Step 11 – Implement and monitor the improvements as per the action plan
Conclusion:
Value Stream Mapping is an effective tool/practice that organizations use to assess as it processes, understand the gaps, eliminate waste, and improve their processes. VSM gives a pictorial view of the current state and gives a common understanding of the shared goals. It enables teams to identify bottlenecks and inefficiencies and helps teams and organizations to deliver value faster.
VSM, though was used more in the manufacturing line, is now used widely in all the fields mentioned in the blog. From mapping the current state, identifying the hiccups and drawing out the future state, VSM enables continuous improvement.
The ability to surface various forms of waste, including overproduction, delays, and unnecessary complexities, enables organizations with the insights needed to implement impactful changes. This not only leads to operational efficiency but also promotes customer satisfaction and faster value delivery.
This brings our blog on “What is Value Stream Mapping” to an end. And we sincerely hope this was helpful. Please reach out to us at “Consult@benzne.com” for any queries or feedback.
FAQ Questions:
1. What is the difference between VSM and process map?
a. Value stream map is visualization of a broader level flow, which includes materials, processes, and the flow of information. Whereas process map is specific to one process and the flow of steps within that.
b. Improvements identified in Value stream map is at a bigger scale like initiatives, transformations whereas improvements identified in process maps are easy to implement as they are smaller process tweaks
c. Value stream map provides strategic planning of long term initiatives, while improvements from process maps are tactical and operational in nature
2. What tools are used for value stream mapping?
There are several tools on the internet which are available to do VSM, some of them include Lucidchart, Smartdraw, Edrawmax, Creately. VSM can also be done with a whiteboard and stickies which enables more physical interaction within the team members.
3. How do you draw a VSM chart or How to implement value stream mapping?
Step 1 – Understand the principles of VSM, get familiar with the tool and the symbols
Step 2 – Narrow down the process you want to target and define the scope of VSM clearly
Step 3 – Identify the people needed from all functions and units to do the VSM and set expectations as to what is needed from them and when
Step 4 – Explain the “Why”, “How” and “What” part of the activity
Step 5 – Schedule the session and send the invite and ensure all logistics are taken care of
Step 6 – For the stream identified, define the process steps. Note that the process steps have to be in detail and not just superficial
Step 7 – For each process step, collect the process data. Collect quantitative metrics which will help evaluate the effectiveness of the step
Step 8 – Perform the Value stream mapping analysis. That is, for each step analyze the data available
Step 9 – Mark the improvements needed. Draft a “To Be” flow with necessary target metrics
Step 10 – Create an action plan with action items and the owners associated with the timeline
Step 11 – Implement and monitor the improvements as per the action plan
4. What is the role of the value stream?
Value Streams highlight the flow of value, delays, rework, and bottlenecks. They illustrate how the current flow affects the people who do all the work.
👉 All the steps necessary to convert the trigger to the delivery of value
👉 The people who perform these steps
👉 The systems they use to do their work
👉 The flow of information and materials that are necessary to satisfy that request
