Introduction to Dora Metrics
Almost all organizations are now adopting DevOps practices to automate their delivery/ deployment processes. Before DevOps, one main challenge organizations faced was that development and operation teams were working in silos and they were two different teams, which usually led to struggles and friction with misaligned goals. Development teams concentrated on speed and delivering features while operations teams prioritised stability and uptime.
In today’s fast-paced markets, organizations require faster and continuous delivery of their product without compromising quality and stability, due to this most of the organizations are now moving towards DevOps practices and they are successful in adopting it. But once any process is implemented there is a golden question we must attempt to answer “How can we optimize them and improve?”
Companies struggle to measure the effectiveness and understand the gaps in their delivery process with output-driven metrics like number of releases, number of lines of code etc. That’s when DevOps Research and Assessment (DORA) came up with a standard set of measurable metrics to quantify and help teams optimize their delivery process. DORA metrics became the go to data driven ways to measure and improve DevOps performance that align their development practices to the goals.
This blog aims at explaining a few fundamental concepts of DORA metrics like:
- What are the 4 DORA Metrics?
- How can they be used to improve a team’s performance?
- How do we understand the DORA Metrics?
- How can DORA Metrics be implemented in your team setup?
- What are the DORA Metrics core objectives?
- DORA metrics core objectives with implementation
- What are a few DORA metrics case studies?
What Are DORA Metrics?
DORA metrics are a set of 4 Dora metrics that helps understand teams about their performance. Google Cloud team after 6 years of research came up with 4 parameters to assess their development efficiency with the goal of improving it to drive better velocity within their teams.
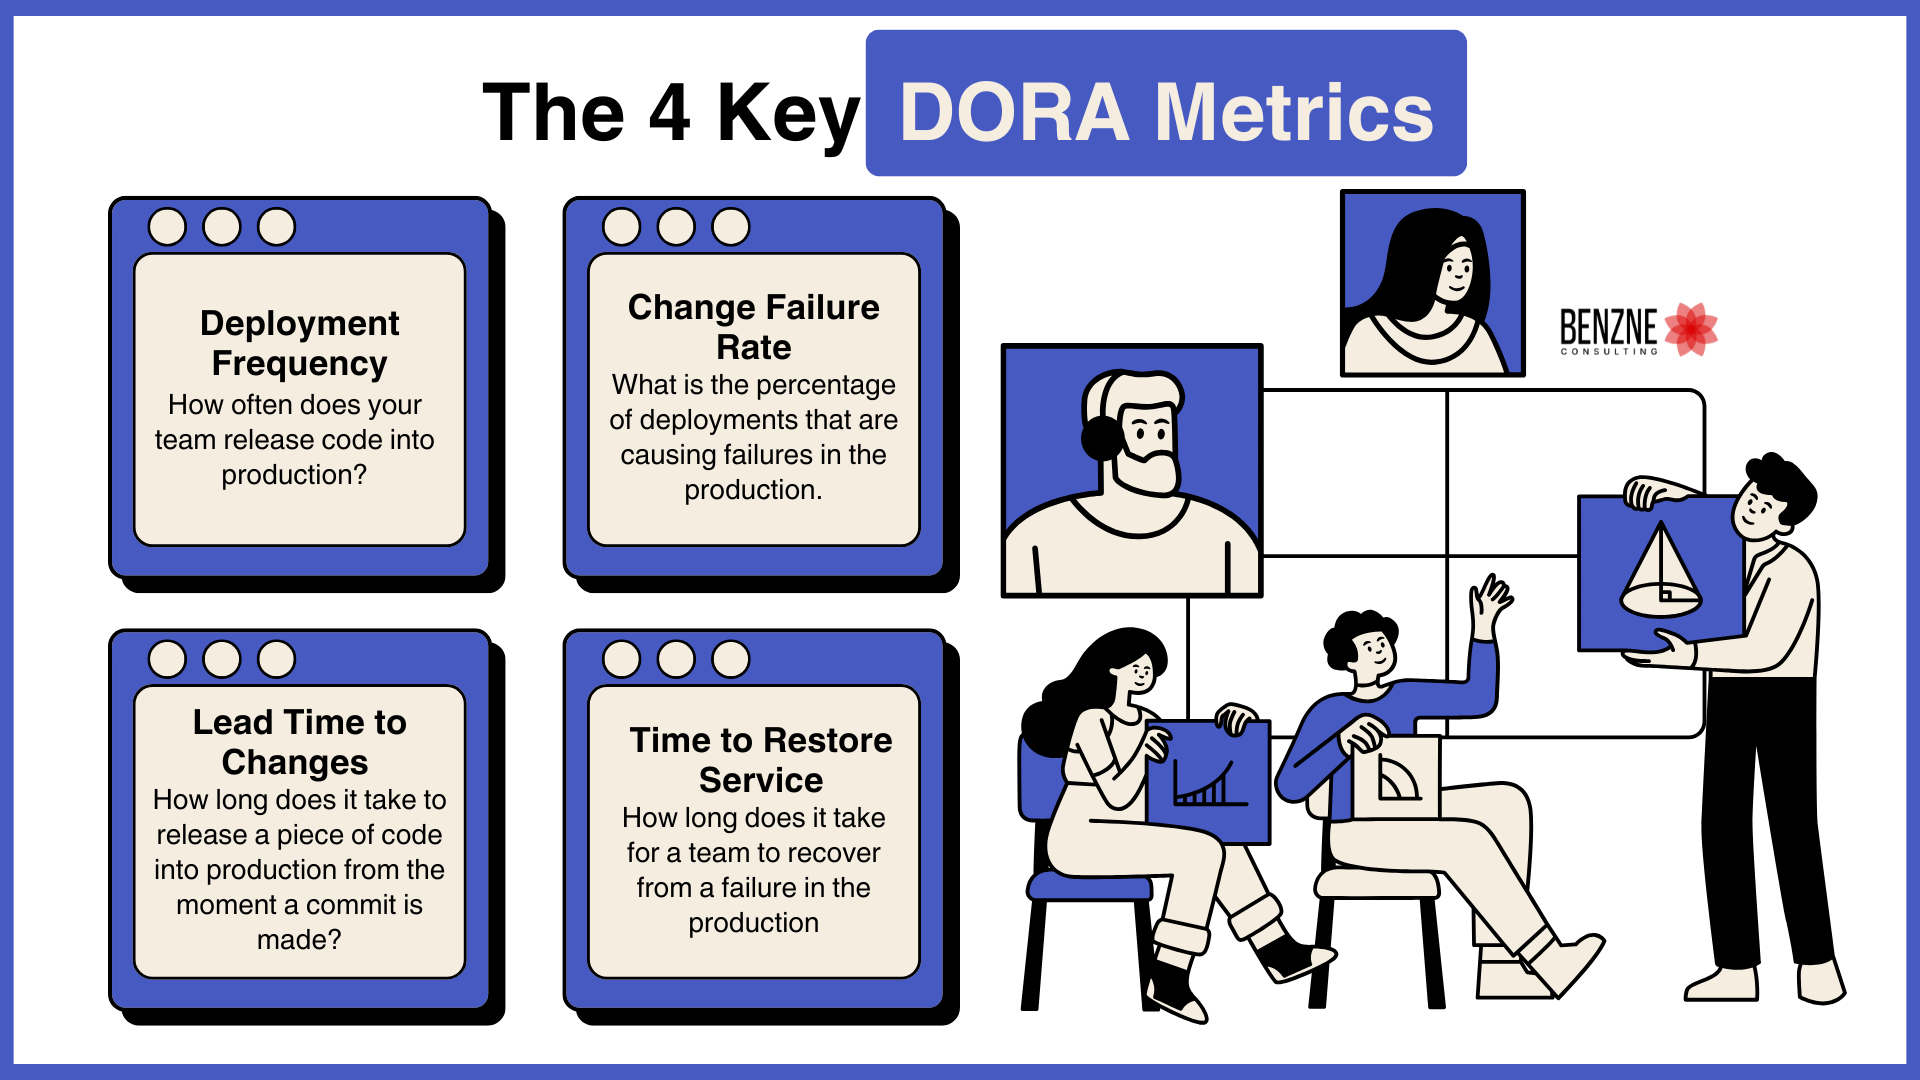
These metrics help in the continuous improvement of DevOps teams and in setting goals based on their current performance. The Dora 4 key metrics are:

- Deployment Frequency – How often does your team release code into production?
- Lead Time to Changes – How long does it take to release a piece of code into production from the moment a commit is made?
- Change Failure Rate – What is the percentage of deployments that are causing failures in the production
- Time to Restore Service – How long does it take for a team to recover from a failure in the production
At a high level, deployment frequency and Lead time to changes represent the throughput of the teams while change failure rate and time to restore service represent the stability of the teams. These metrics can be used to assess any pipeline or process in any type of organization. However, benchmarking and baselining depends on the type of business, team’s maturity and is contextual. Let’s understand these Dora four key metrics in greater detail:
Deployment Frequency
Agile teams work in an iterative and incremental manner. Which promotes smaller releases continuously. Deployment Frequency is one of the DORA metrics which represents the number of deployments in a particular time frame (Weeks, Monthly, Quarterly). Higher deployment frequency denotes mature CI/CD pipelines and agility while lower denotes gaps and needs improvements. Deployment frequency helps teams understand/gauge how fast they can deliver value to the customers and respond to changes.
How is Deployment Frequency Calculated?
The first step is to calculate and track the number of successful code deployments over a fixed time frame. Let’s say there were 2 deployments everyday for a week, then the metrics is the sum of all the deployments over the week. That is, 10 deployments/working week
Benchmarking
DORA has defined the baselining of deployment frequency signifying the maturity of the DevOps pipeline and team’s performance. Let’s have a look at it:
- Elite Teams – Multiple deployments per day
- High performing teams – Deployments once per day to once per week
- Medium Performance – Deployment once every month to once every 6 months
- Low performance – Fewer than once every 6 months
How to Improve deployment frequency
Here are a few pointers which could help your teams improve deployment frequency:
- Break work items into smaller meaningful chunks
- Automate testing process like regression, sanity and smoke testing
- Implement CI and CD pipelines
- Adopt to trunk based development
- Promote continuous delivery vs single big fat releases
Lead Time to Changes
This DORA metrics signifies the speed at which code changes are delivered to production systems. This metric captures the time taken from the time a piece of code is committed till the time that code is migrated/deployed to production systems. This helps the teams to assess how fast a team can respond to changes like improvement, enhancements, new feature requests, bug fixes or updates. This indirectly measures the flow of work through the pipelines by surfacing the efficiency of the pipeline built. Less lead time indicates efficient workflow of the pipelines while more lead time indicates potential bottlenecks and inefficiencies.
How is Change Lead Time Calculated?
This can be calculated using timestamps of version control tools like Git, Bitbucket etc. Calculate the time when the code was committed and calculate the time when the code was deployed and subtract them. Average Lead time = Average of lead time for changes / Number of changes.
Benchmarking
Based on this DORA metric, teams can again be classified based on their lead time to change:
- Elite Teams – Less than an hour
- High performing teams – Between one day or one week
- Medium Performance – Between one month or 6 months
- Low performance – More than 6 months
How to Improve Lead Time to Change?
Here are a few pointers which could help your teams reduce Lead Time to Change:
- Use Value stream mapping to assess the process
- Automate building , testing and deployments using tools
- Promote daily check ins
- Break work items into smaller pieces
- Adopt to trunk based development
Change Failure Rate
Change Failure Rate is the 3rd DORA metrics which helps teams to understand the stability and the quality of their DevOps systems. This signifies the percentage of deployments that fail in the production systems requiring rollbacks, hotfixes, downtime etc. Higher failure rate depicts less quality, coding standards etc while lower failure rate depicts more mature testing, coding standards.
How is Change Failure Rate Calculated?
First set a time frame and calculate the number of deployments. Next step is to identify the number of failed deployments which potentially caused rollback, downtime, service degradation etc. Formula to calculate the change failure rate = Number of failed deployments / Total number of deployments * 100.
Benchmarking
Like any other DORA metrics, teams can again be classified based on their change failure rate:
- Elite Teams – 0 – 15%
- High performing teams – 16 – 30 %
- Medium Performance – 16 – 30%
- Low performance – More than 16 – 30%
How to Improve Change Failure Rate?
Here are a few pointers which could help your teams reduce Change Failure Rate:
- Strengthen the testing practices like regression testing, sanity testing, smoke testing using automation
- Set proper coding standards
- Concentrate on code reviews, peer reviews etc
- Bring in automated deployments to reduce human errors
Mean Time To Recovery (MTTR)
MTTR is the 4th DORA metric which helps teams understand how fast they can recover from a failure in the production system. The time taken from an issue is identified in the production system like downtime, service down till the time the production systems are back to normal functioning stage. Lower MTTR means robust troubleshooting process and practice in a team which is well prepared versus higher MTTR means gaps in the troubleshooting flow.
How is Mean Time To Recovery Calculated?
The first step is to calculate the number of incidents which caused the systems to fail. Calculate time taken for all the incidents to restore the production systems. Formula to calculate the MTTR = Total time taken for X incidents to restore / X incidents.
Benchmarking
Like any other DORA metrics, teams can again be classified based on their Mean time to recovery:
- Elite Teams – Less than an hour
- High performing teams – Less than a day
- Medium Performance – Between 1 day to 1 week
- Low performance – More than 6 months
How to Improve Mean Time To Recovery?
Here are a few pointers that could help your teams reduce Mean Time To Recovery:
- Use tools like datadog, new relic, etc to quickly alert in case of an incident
- Use automation for any alerts or incident response
- Try to automate to fix frequently occurring incidents
- Use concepts like feature toggles, blue green deployments to reduce the failures
- Strengthen the teams on incident response and fixing
How DORA Metrics Can Improve DevOps Processes?
DORA metrics is a proven framework that provides quantifiable metrics which in turn helps teams assess and get actionable insights with respect to performance and efficiency of your delivery and operation efficiency. These metrics enable teams to surface up bottlenecks, and streamline the flow, by focusing on speed, reliability, and throughput of your delivery processes. Let’s understand in detail as to how DORA metrics can improve DevOps processes:
- All four DORA metrics help us quantify our efficiency. This helps in data-driven decisions on where and what to improve
- Helps get leadership buy-in with respect to tools, resource allocation, and necessary process changes
- Helps the team focus on what is a priority rather than multiple teams focusing on multiple priorities
- These metrics can serve as a direct single source of truth to promote initiatives like automation testing, and automated deployments, also push teams to automate repetitive tasks
- Helps teams to arrest issues before they escalate
- Provides an environment for the developers to innovate with new tools
- Increases agility and enables teams to respond to change frequently without much cost
- Allows teams to compare themselves with industry standards to bring in the most efficient flow of work
The Relationship Between DORA and SPACE Metrics
Both DORA metrics and SPACE metrics are two powerful frameworks that can be used to measure the software delivery/ operational performance and improve. They are complimentary and can be used together. DORA metrics mainly focusses on the performance and stability of the DevOps processes, SPACE concentrates on evaluating both technical and human aspects of productivity and well being.
SPACE framework which was introduced by microsoft and github concentrates on 5 aspects:
- Satisfaction and well being – Which denotes how satisfied and engaged the developers are
- Performance – The objectives and results achieved by the team
- Activity – How much of work the teams are doing
- Communication and Collaboration – How well the teams are communicating and collaborating
- Efficiency – How efficiently the team can work and delivery value
Let’s understand how DORA and SPACE can work together in your system:
- While DORA metrics concentrate on speed, reliability and scalability, the Performance pillar in SPACE concentrates on features delivered, uptime and resolved bugs. DORA metrics can be viewed as a subset of SPACE.
- Balancing developer well being with the speed of delivery. DORA concentrates on frequent and stable releases which may stress the developers. While SPACE metrics can ensure delivery speed does not burn out the developers
- DORA metrics help enhance collaboration especially between development and ops teams. SPACE metrics help measure the collaboration effectiveness between them
- The activity pillar of SPACE measures developer actions like commits, pull requests etc which may not relate to the outcome delivered. But DORA metrics can help understand this factor of activities versus value delivered
- DORA metrics concentrates on delivery efficiency while SPACE metrics take a broader view including developer happiness and engagement
Core Objectives and Implementation of DORA Metrics
DORA metrics core objectives are to assess and improve the efficiency of delivery pipelines. DORA metrics provide quantifiable measures enabling teams to identify gaps, streamline processes, and track progress over time. By setting clear goals and measuring the performance against these goals, companies can promote a culture of innovation and continuous improvement:
- Deployment frequency – By increasing the frequency of deployments, teams can deliver value to the customers more rapidly
- Lead time for changes – Reducing the time taken to deploy a change from code commit to production systems reduces delays in time to market
- Change Failure rate – Reducing the percentage of deployment that results in failures, teams can reduce downtime and help increase customer satisfaction
- Mean time to restore – Reducing the time taken to recover from a failure ensures business continuity and reduces business disruptions
DORA Metrics Tools and Platforms
DORA metrics can be captured with the help of a lot of tools and platforms by integrating them with the DevOps pipelines. Here are a few popular tools that most of the teams/organizations are currently using to capture them:

- Google Cloud DevOps Research and Assessment – For teams who are already using Google Cloud and are looking for insights based on standards, this tool can integrate with Google services and provide recommendations.
- GitLab – A complete DevOps platform that tracks DORA metrics natively. Which consists of features like CI/CD pipelines, and detailed dashboards to view the metrics.
- CircleCI – A popular CI/CD platform with inbuilt DORA metrics-capturing capabilities. With features like automated feedback loops, it provides reports on pipeline efficiency. Best suited for teams concentrating on optimizing their pipelines.
- Plandek – An engineering analytics tool designed for agile and DevOps teams with features like tracking all DORA metrics, customizable dashboards, and reports, integrations with JIRA, Azure DevOps, etc. Best suited for teams looking to view their entire engineering efficiency.
- LinearB – A developer flow optimization tool with inbuilt DORA metrics capturing capabilities. Features include DORA monitoring, team-level specific actionable items recommendations, and Integration with tools like JIRA, Slack, Git, etc. Best suited for teams concentrating on improving development flow.
- Harness – A continuous delivery as a service platform with DORA metrics support. It comes with inbuilt features like real-time dashboards, and AI-powered incident tracking and is best suited for teams looking to automate deployment and delivery automation.
DORA Metrics Case Studies
Case Study 1 : Accelerating deployment at a financial services company
Company: A global financial services firm
Challenge: Slow and infrequent deployments due to complex legacy systems and a lack of visibility into the development pipeline
Approach:
- Implemented a CI/CD pipeline using Gitlab
- Automated testing and deployment processes to reduce manual intervention
- Tracked Deployment frequency and lead time to changes to identify gaps
Outcome:
- Increases deployment frequency from once a month to weekly releases
- Reduced lead time to change from 10 days to 3 days by automating repetitive tasks
Case Study 2 : Reducing downtime in an E-Commerce platform
Company: A large online retail platform
Challenge: Frequent production failures during peak shopping seasons, resulting in a drop in customer satisfaction and revenue loss
Approach:
- Deployed datalog for real-time monitoring and incident alerting
- Used Sleuth to track change failure rate and categorize failures by root cause
- Introduced canary releases to test changes in small releases before full deployment
Outcome:
- Reduced change failure rate from 20% to 10% by detecting and addressing issues earlier
- MTTR dropped from 8 hours to under 2 hours ensuring quicker recovery from incidents
Case Study 3 : Scaling software delivery in a health startup
Company: A growing health tech startup offering telemedicine services
Challenge: Difficulty in scaling delivery processes while maintaining system reliability during rapid growth
Approach:
- Implemented Azure DevOps to centralise CI/CD workflows and track metrics
- Focussed on team training to ensure consistent application of DevOps best practices
- Established OKRs tied to DORA metrics such as reducing lead time to under 24 hours
Outcome:
- Deployment Frequency increased from Bi-Weekly to daily
- Lead time for changes reduced from 5 days to within 24 hours
- Change Failure rate reduced from 18% to 8%
Conclusion
In today’s fast-paced environment, organizations must continuously concentrate on improving their delivery processes. DORA metrics are a powerful framework for measuring and optimizing these processes. Teams can identify bottlenecks, accelerate delivery, and improve quality by focusing on key metrics like deployment frequency, lead to for changes, change failure rate, and mean time to restore.
DORA metrics being a framework that focuses on measurable metrics help teams in data-driven decision-making and leverage the right set of tools and technologies, and organizations can achieve great improvements in their software delivery performance.
There are several tools available in the market that help teams track, monitor, and implement DORA metrics in their organizations. While the benchmarks are set by DORA, one pitfall to avoid is to run behind the benchmarking without understanding the business context. Teams and organizations should first understand their business context and then strive to make their processes efficient. We, at Benzne Agile Transformation Service, would be glad to support you in implementing DORA metrics for your teams, please feel free to schedule a discovery call with our team of consultants to explore how we can help.
With this, our blog on “DORA Metrics: Accelerate DevOps Success and Performance” comes to an end and we sincerely hope that this has helped you understand it. For any feedback or suggestions please write to consult@benzne.com.

